Indicadores <strong>de</strong> Comercio Exterior • <strong>Cuarto</strong> Trimestre <strong>de</strong> 2006IMPORTACIONES DE CHILE CLASIFICADAS DE ACUERDO CON LA CUCI(Millones <strong>de</strong> US$ cif)Especificación2005 2006IV trim. Año I trim. II trim. III trim. IV trim. Año0 PRODUCTOS ALIMENTICIOS Y ANIMALES VIVOS 466,5 1.630,3 508,3 491,9 496,9 603,1 2.100,20 Animales vivos no incluidos en el capítulo 03 1,7 4,8 1,9 1,3 1,6 1,4 6,21 Carne y preparados <strong>de</strong> carne 105,1 370,1 74,9 79,7 68,6 117,0 340,22 Productos lácteos y huevos <strong>de</strong> ave 21,1 78,9 23,8 25,8 19,1 9,9 78,53 Pescado, crustáceos y moluscos 12,0 47,2 13,2 14,8 14,2 14,3 56,64 Cereales y preparados <strong>de</strong> cereales 86,2 282,1 144,9 111,9 127,8 147,3 531,95 Legumbres y frutas 37,2 126,5 31,4 38,3 38,9 43,6 152,26 Azúcar y preparados <strong>de</strong> azúcar y miel 36,4 109,1 29,2 29,4 33,7 47,2 139,57 Café, té, cacao, especias y sus preparados 22,7 105,7 26,9 33,6 27,2 31,4 119,18 Pienso para animales (excluidos cereales sin moler) 80,8 279,5 98,0 88,5 98,1 114,5 399,19 Productos y preparados comestibles 63,3 226,6 64,2 68,5 67,7 76,5 277,01 BEBIDAS Y TABACO 21,8 66,4 13,8 13,6 16,8 24,7 69,111 Bebidas 16,4 48,8 12,2 12,0 14,2 22,2 60,612 Tabaco y sus productos 5,4 17,7 1,7 1,7 2,6 2,5 8,52 MATERIALES CRUDOS NO COMESTIBLES, EXCLUIDOS COMBUSTIBLES 304,8 1.242,1 280,4 273,0 325,5 344,7 1.223,621 Cuero, pieles y pieles finas sin curtir 0,0 0,1 0,0 0,0 0,0 0,0 0,022 Semillas y frutos oleaginosos 20,1 62,5 14,8 11,9 13,5 15,0 55,223 Caucho en bruto (incluidos el sintético y regenerado) 16,2 69,7 19,2 23,8 18,5 16,1 77,624 Corcho y ma<strong>de</strong>ra 6,6 24,1 6,5 6,2 6,6 6,2 25,425 Pasta y <strong>de</strong>sperdicios <strong>de</strong> papel 6,7 34,0 4,2 5,0 4,6 7,4 21,226 Fibra textil y sus <strong>de</strong>sperdicios 25,2 96,2 20,8 25,6 22,8 21,8 91,127 Abono en bruto y mineral en bruto 9,4 58,7 12,8 21,1 10,1 12,1 56,128 Menas y <strong>de</strong>sechos <strong>de</strong> metal 202,1 816,0 177,3 157,3 228,5 243,0 806,129 Productos animales y vegetales en bruto n.e.p. 18,4 80,8 24,8 22,1 20,8 23,1 90,93 COMBUSTIBLES Y LUBRICANTES MINERALES Y PRODUCTOS CONEXOS 1.644,7 6.526,1 1.911,3 2.296,0 2.259,3 1.981,2 8.447,732 Hulla, coque y briquetas 50,7 295,5 76,1 87,4 78,5 89,3 331,433 Petróleo, productos <strong>de</strong>rivados y conexos 1.403,6 5.354,0 1.612,5 1.979,4 1.944,4 1.618,2 7.154,434 Gas natural y manufacturado 179,4 821,5 204,5 209,9 216,1 258,4 888,835 Corriente eléctrica 11,1 55,0 18,3 19,3 20,2 15,3 73,14 ACEITE, GRASA Y CERA DE ORIGEN ANIMAL Y VEGETAL 26,0 91,5 25,9 28,5 37,3 35,1 126,741 Aceite y grasa <strong>de</strong> origen animal 13,6 42,2 12,2 11,2 14,1 20,5 58,042 Aceite y grasa fijos <strong>de</strong> origen vegetal, en bruto 4,9 21,7 5,3 11,1 15,4 7,7 39,543 Aceite y grasa <strong>de</strong> origen animal o vegetal, elaborados 7,4 27,6 8,3 6,2 7,7 6,9 29,25 PRODUCTOS QUÍMICOS Y PRODUCTOS CONEXOS, N.E.P. 831,9 3.435,3 900,9 978,8 1.063,6 978,1 3.921,551 Productos químicos orgánicos 92,2 392,6 119,3 112,7 112,5 111,5 456,152 Productos químicos inorgánicos 89,2 339,7 101,5 106,2 106,3 106,5 420,553 Materias tintóreas, curtientes y colorantes 64,8 253,9 62,3 73,6 75,7 76,0 287,654 Productos medicinales y farmacéuticos 101,0 429,8 120,5 135,0 130,9 114,3 500,755 Aceites esenciales y resinoi<strong>de</strong>s, productos <strong>de</strong> perfumería 86,4 333,3 87,5 96,5 105,8 99,0 388,856 Abono (excepto <strong>de</strong>l grupo 272) 40,0 256,0 32,3 51,0 106,7 60,7 250,757 Plástico en forma primaria 182,7 714,8 193,2 193,4 200,4 198,5 785,558 Plástico en forma no primaria 67,4 263,3 71,7 70,6 67,8 76,3 286,459 Materias y productos químicos n.e.p. 108,2 451,7 112,6 139,8 157,5 135,2 545,16 ARTIÍCULOS MANUFACTURADOS, CLASIFICADOS SEGÚN EL MATERIAL 917,6 3.504,1 987,6 959,7 996,4 1.091,2 4.034,961 Cuero, manufacturas <strong>de</strong> cuero y pieles finas 3,5 15,4 4,2 4,1 5,7 5,4 19,562 Manufacturas <strong>de</strong> caucho, n.e.p. 93,7 352,8 94,1 100,2 100,7 101,8 396,863 Manufacturas <strong>de</strong> corcho y <strong>de</strong> ma<strong>de</strong>ra (excluidos muebles) 27,9 136,2 37,9 46,4 34,9 40,6 159,764 Papel, cartón y artículos <strong>de</strong> pasta <strong>de</strong> papel 143,5 531,5 133,2 130,8 145,9 163,6 573,565 Hilados, tejidos, artículos <strong>de</strong> fibra textil y artículos conexos 123,0 462,1 116,5 134,0 139,4 133,2 523,166 Manufacturas <strong>de</strong> minerales no metálicos n.e.p. 91,8 330,0 96,9 85,4 92,1 99,7 374,067 Hierro y acero 210,2 852,8 274,9 218,0 239,9 291,1 1.023,968 Metales no ferrosos 41,6 169,4 47,6 63,0 62,4 73,0 246,069 Manufacturas <strong>de</strong> metales, n.e.p. 182,3 653,8 182,2 177,9 175,5 182,7 718,37 MAQUINARIA Y EQUIPOS DE TRANSPORTE 3.096,8 10.749,2 2.734,7 2.786,9 2.923,3 3.260,5 11.705,471 Maquinaria y equipos generadores <strong>de</strong> fuerza 107,6 463,7 144,1 130,1 158,2 134,3 566,672 Maquinaria especial para <strong>de</strong>terminadas industrias 419,4 1.747,8 322,5 350,4 406,3 402,8 1.482,173 Máquinas para trabajar metal 19,8 93,0 21,5 25,8 24,2 25,4 97,074 Maquinaria y equipos industriales y sus partes, n.e.p. 472,1 1.605,2 457,9 398,4 424,4 469,8 1.750,575 Máquinas <strong>de</strong> oficina y máquinas <strong>de</strong> procesamiento automático <strong>de</strong> datos 245,0 826,2 209,7 253,8 239,9 260,8 964,176 Aparatos y equipos para telecomunicación y grabación y reproducción <strong>de</strong> sonido 412,9 1.303,6 345,1 447,7 422,1 568,5 1.783,477 Maquinaria, aparatos y artefactos eléctricos n.e.p. y sus partes 300,9 1.094,8 279,4 329,5 332,6 360,8 1.302,278 Vehículos <strong>de</strong> carretera (incluso aero<strong>de</strong>slizadores) 1.016,4 3.254,7 864,0 797,5 891,5 883,2 3.436,279 Otros equipos <strong>de</strong> transporte 102,7 360,1 90,6 53,8 24,0 154,9 323,28 ARTÍCULOS MANUFACTURADOS DIVERSOS 690,7 2.574,3 783,1 628,0 898,9 844,0 3.154,081 Edificios prefabricados; artefactos y accesorios sanitarios 21,6 80,0 21,1 24,3 26,1 25,0 96,482 Muebles y sus partes; camas, colchones, somieres 36,5 120,5 37,8 36,3 49,3 51,1 174,583 Arículos <strong>de</strong> viaje, bolsos <strong>de</strong> mano y otros análogos 22,8 62,8 20,0 13,7 18,3 23,5 75,584 Prendas y accesorios <strong>de</strong> vestir 173,3 794,8 305,7 178,2 306,9 214,7 1.005,685 Calzado 72,0 306,8 102,9 56,6 122,2 93,0 374,687 Instrumentos y aparatos profesionales, científicos y <strong>de</strong> control, n.e.p. 86,9 327,4 90,3 92,2 100,2 103,7 386,588 Aparatos, equipos y material fotográfico y <strong>de</strong> óptica n.e.p., relojes 53,7 163,7 37,6 42,3 47,1 53,8 180,889 Artículos manufacturados diversos, n.e.p. 223,8 718,2 167,6 184,5 228,7 279,2 860,09 OTROS n.e.p. 143,6 835,7 321,0 331,3 309,1 292,0 1.253,4Zona Franca 588,2 1.981,6 522,4 569,6 665,0 696,0 2.453,1TOTAL 8.732,6 32.636,6 8.989,6 9.357,3 9.992,1 10.150,6 38.489,6N.E.P.: No clasificado ni incluido en otra parte.Fuente: Declaraciones <strong>de</strong> ingreso.67
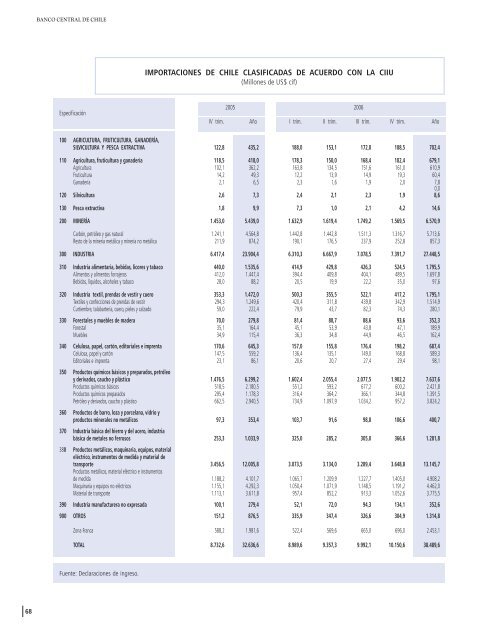
BANCO CENTRAL DE CHILEIMPORTACIONES DE CHILE CLASIFICADAS DE ACUERDO CON LA CIIU(Millones <strong>de</strong> US$ cif)Especificación2005 2006IV trim. Año I trim. II trim. III trim. IV trim. Año100 AGRICULTURA, FRUTICULTURA, GANADERÍA,SILVICULTURA Y PESCA EXTRACTIVA 122,8 435,2 188,0 153,1 172,8 188,5 702,4110 Agricultura, fruticultura y gana<strong>de</strong>ría 118,5 418,0 178,3 150,0 168,4 182,4 679,1Agricultura 102,1 362,2 163,8 134,5 151,6 161,0 610,9Fruticultura 14,2 49,3 12,2 13,9 14,9 19,3 60,4Gana<strong>de</strong>ría 2,1 6,5 2,3 1,6 1,9 2,0 7,80,0120 Silvicultura 2,6 7,3 2,4 2,1 2,3 1,9 8,6130 Pesca extractiva 1,8 9,9 7,3 1,0 2,1 4,2 14,6200 MINERÍA 1.453,0 5.439,0 1.632,9 1.619,4 1.749,2 1.569,5 6.570,9Carbón, petróleo y gas natural 1.241,1 4.564,8 1.442,8 1.442,8 1.511,3 1.316,7 5.713,6Resto <strong>de</strong> la minería metálica y minería no metálica 211,9 874,2 190,1 176,5 237,9 252,8 857,3300 INDUSTRIA 6.417,4 23.904,4 6.310,3 6.667,9 7.078,5 7.391,7 27.448,5310 Industria alimentaria, bebidas, licores y tabaco 440,0 1.535,6 414,9 429,8 426,3 524,5 1.795,5Alimentos y alimentos forrajeros 412,0 1.447,4 394,4 409,8 404,1 489,5 1.697,8Bebidas, líquidos, alcoholes y tabaco 28,0 88,2 20,5 19,9 22,2 35,0 97,6320 Industria textil, prendas <strong>de</strong> vestir y cuero 353,3 1.472,0 500,3 355,5 522,1 417,2 1.795,1Textiles y confecciones <strong>de</strong> prendas <strong>de</strong> vestir 294,3 1.249,6 420,4 311,8 439,8 342,9 1.514,9Curtiembre, talabartería, cuero, pieles y calzado 59,0 222,4 79,9 43,7 82,3 74,3 280,1330 Forestales y muebles <strong>de</strong> ma<strong>de</strong>ra 70,0 279,8 81,4 88,7 88,6 93,6 352,3Forestal 35,1 164,4 45,1 53,9 43,8 47,1 189,9Muebles 34,9 115,4 36,3 34,8 44,9 46,5 162,4340 Celulosa, papel, cartón, editoriales e imprenta 170,6 645,3 157,0 155,8 176,4 198,2 687,4Celulosa, papel y cartón 147,5 559,2 136,4 135,1 149,0 168,8 589,3Editoriales e imprenta 23,1 86,1 20,6 20,7 27,4 29,4 98,1350 Productos químicos básicos y preparados, petróleoy <strong>de</strong>rivados, caucho y plástico 1.476,5 6.299,2 1.602,4 2.055,4 2.077,5 1.902,2 7.637,6Productos químicos básicos 518,5 2.180,5 551,2 593,2 677,2 600,2 2.421,8Productos químicos preparados 295,4 1.178,3 316,4 364,2 366,1 344,8 1.391,5Petróleo y <strong>de</strong>rivados, caucho y plástico 662,5 2.940,5 734,9 1.097,9 1.034,2 957,2 3.824,2360 Productos <strong>de</strong> barro, loza y porcelana, vidrio yproductos minerales no metálicos 97,3 353,4 103,7 91,6 98,8 106,6 400,7370 Industria básica <strong>de</strong>l hierro y <strong>de</strong>l acero, industriabásica <strong>de</strong> metales no ferrosos 253,3 1.033,9 325,0 285,2 305,0 366,6 1.281,8380 Productos metálicos, maquinaria, equipos, materialeléctrico, instrumentos <strong>de</strong> medida y material <strong>de</strong>transporte 3.456,5 12.005,8 3.073,5 3.134,0 3.289,4 3.648,8 13.145,7Productos metálicos, material eléctrico e instrumentos<strong>de</strong> medida 1.188,2 4.101,7 1.065,7 1.209,9 1.227,7 1.405,0 4.908,2Maquinaria y equipos no eléctricos 1.155,1 4.292,3 1.050,4 1.071,9 1.148,5 1.191,2 4.462,0Material <strong>de</strong> transporte 1.113,1 3.611,8 957,4 852,2 913,3 1.052,6 3.775,5390 Industria manufacturera no expresada 100,1 279,4 52,1 72,0 94,3 134,1 352,6900 OTROS 151,2 876,5 335,9 347,4 326,6 304,9 1.314,8Zona Franca 588,2 1.981,6 522,4 569,6 665,0 696,0 2.453,1TOTAL 8.732,6 32.636,6 8.989,6 9.357,3 9.992,1 10.150,6 38.489,6Fuente: Declaraciones <strong>de</strong> ingreso.68