Indicadores <strong>de</strong> Comercio Exterior • <strong>Cuarto</strong> Trimestre <strong>de</strong> 2006EXPORTACIÓN DE LOS PRINCIPALES PRODUCTOS CLASIFICADOS DE ACUERDO CON LA CIIU<strong>Cuarto</strong> Trimestre 2006CLAVE 384MATERIAL DE TRANSPORTEValor en millones <strong>de</strong> US$ fobPrincipales productosAño2005 2006IV <strong>trimestre</strong> I <strong>trimestre</strong> II <strong>trimestre</strong> III <strong>trimestre</strong> IV <strong>trimestre</strong>Cantidad Precio Valor Cantidad Precio Valor Cantidad Precio Valor Cantidad Precio Valor Cantidad Precio Valor Cantidad Precio Valor(US$) (US$) (US$) (US$) (US$) (US$)Automóviles (unidad) 374 7.455 2,8 174 7.730 1,3 69 10.690 0,7 92 9.474 0,9 215 8.402 1,8 101 9.862 1,0Carrocerías <strong>de</strong> vehículo (unidad) 146 76.734 11,2 50 106.354 5,3 57 30.651 1,7 107 52.824 5,7 72 73.377 5,3 80 72.146 5,8Chasis con cabina (unidad) 1.462 7.747 11,3 150 7.164 1,1 1 14.000 0,0 27 32.384 0,9 15 47.481 0,7 28 46.528 1,3Las <strong>de</strong>más partes para vehículomotorizado (tn) 2.153 6.239 13,4 611 3.694 2,3 388 3.865 1,5 730 4.020 2,9 1.021 5.244 5,4 765 7.276 5,6Motores (unidad) 402 21.809 8,8 112 8.363 0,9 214 2.429 0,5 119 11.858 1,4 167 20.472 3,4 120 19.945 2,4Órganos <strong>de</strong> transmisión paravehículo (tn) 5.378 9.055 48,7 1.273 9.019 11,5 1.329 8.965 11,9 1.263 8.918 11,3 1.594 9.323 14,9 1.561 9.768 15,2Buses (unidad) 68 19.354 1,3 19 16.647 0,3 12 5.073 0,1 11 6.027 0,1 36 4.581 0,2 64 24.813 1,6Camionetas (unidad) 5.576 11.649 65,0 600 13.501 8,1 515 16.500 8,5 597 16.788 10,0 482 16.020 7,7 1.126 18.011 20,3Bicicletas y <strong>de</strong>más ciclos sin motor(unidad) 5.638 76 0,4 2.818 76 0,2 300 117 0,0 75 134 0,0 2.786 11 0,0 1.540 99 0,2Aviones (unidad) 10 250.022 2,5 2 397.500 0,8 - - - 5 45.840 0,2 1 155.000 0,2 3 45.770 0,1Partes <strong>de</strong> aviones o helicópteros (tn) 49 337.155 16,5 8 362.333 2,9 29 125.540 3,6 7 407.594 2,8 11 313.550 3,5 7 485.947 3,6Barcos para transporte <strong>de</strong> personasy mercancías (unidad) 3 16.741.041 50,2 2 24.603.864 49,2 - - - 2 23.660.355 47,3 1 3.985.947 4,0 - - -Barcos pesqueros (unidad) 2 3.198.085 6,4 - - - - - - 1 510.000 0,5 - - - - - -RESTO 28,1 6,7 14,7 7,2 16,5 9,0TOTAL AGREGACIÓN MAYOR 266,6 90,6 43,3 91,2 63,5 66,057
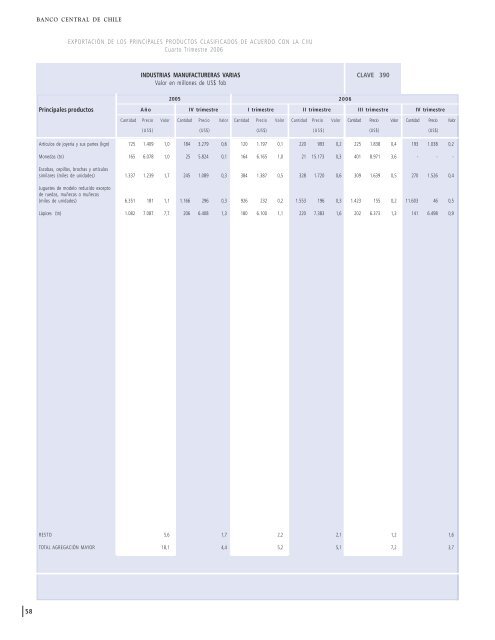
BANCO CENTRAL DE CHILEEXPORTACIÓN DE LOS PRINCIPALES PRODUCTOS CLASIFICADOS DE ACUERDO CON LA CIIU<strong>Cuarto</strong> Trimestre 2006INDUSTRIAS MANUFACTURERAS VARIASValor en millones <strong>de</strong> US$ fobCLAVE 390Principales productos20052006AñoIV <strong>trimestre</strong> I <strong>trimestre</strong> II <strong>trimestre</strong> III <strong>trimestre</strong> IV <strong>trimestre</strong>Cantidad Precio Valor Cantidad Precio Valor Cantidad Precio Valor Cantidad Precio Valor Cantidad Precio Valor Cantidad Precio Valor(US$) (US$) (US$) (US$) (US$) (US$)Artículos <strong>de</strong> joyería y sus partes (kgn) 725 1.409 1,0 184 3.279 0,6 120 1.197 0,1 220 993 0,2 225 1.838 0,4 193 1.038 0,2Monedas (tn) 165 6.078 1,0 25 5.824 0,1 164 6.165 1,0 21 15.173 0,3 401 8.971 3,6 - - -Escobas, cepillos, brochas y artículossimilares (miles <strong>de</strong> unida<strong>de</strong>s) 1.337 1.239 1,7 245 1.089 0,3 384 1.387 0,5 328 1.720 0,6 309 1.639 0,5 270 1.526 0,4Juguetes <strong>de</strong> mo<strong>de</strong>lo reducido excepto<strong>de</strong> ruedas, muñecas o muñecos(miles <strong>de</strong> unida<strong>de</strong>s) 6.351 181 1,1 1.166 296 0,3 926 232 0,2 1.553 196 0,3 1.423 155 0,2 11.603 46 0,5Lápices (tn) 1.082 7.087 7,7 206 6.408 1,3 180 6.100 1,1 220 7.383 1,6 202 6.373 1,3 141 6.498 0,9RESTO 5,6 1,7 2,2 2,1 1,2 1,6TOTAL AGREGACIÓN MAYOR 18,1 4,4 5,2 5,1 7,2 3,758