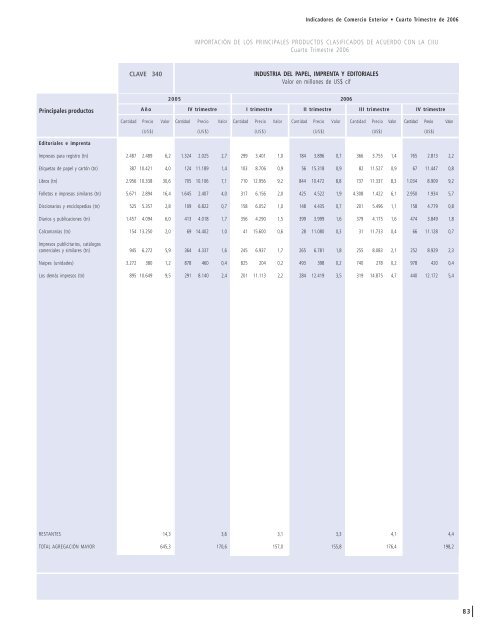
Indicadores <strong>de</strong> Comercio Exterior • <strong>Cuarto</strong> Trimestre <strong>de</strong> 2006IMPORTACIÓN DE LOS PRINCIPALES PRODUCTOS CLASIFICADOS DE ACUERDO CON LA CIIU<strong>Cuarto</strong> Trimestre 2006CLAVE 340INDUSTRIA DEL PAPEL, IMPRENTA Y EDITORIALESValor en millones <strong>de</strong> US$ cifPrincipales productosAño2005 2006IV <strong>trimestre</strong> I <strong>trimestre</strong> II <strong>trimestre</strong> III <strong>trimestre</strong> IV <strong>trimestre</strong>Cantidad Precio Valor Cantidad Precio Valor Cantidad Precio Valor Cantidad Precio Valor Cantidad Precio Valor Cantidad Precio Valor(US$) (US$) (US$) (US$) (US$) (US$)Editoriales e imprentaImpresos para registro (tn) 2.487 2.489 6,2 1.324 2.025 2,7 299 3.401 1,0 184 3.896 0,7 366 3.755 1,4 765 2.813 2,2Etiquetas <strong>de</strong> papel y cartón (tn) 387 10.421 4,0 124 11.189 1,4 103 8.706 0,9 56 15.318 0,9 82 11.527 0,9 67 11.447 0,8Libros (tn) 2.956 10.338 30,6 705 10.106 7,1 710 12.956 9,2 844 10.472 8,8 737 11.337 8,3 1.034 8.909 9,2Folletos e impresos similares (tn) 5.671 2.894 16,4 1.645 2.407 4,0 317 6.156 2,0 425 4.522 1,9 4.308 1.422 6,1 2.950 1.934 5,7Diccionarios y enciclopedias (tn) 525 5.357 2,8 109 6.822 0,7 158 6.052 1,0 148 4.435 0,7 201 5.496 1,1 158 4.779 0,8Diarios y publicaciones (tn) 1.457 4.094 6,0 413 4.018 1,7 356 4.290 1,5 399 3.999 1,6 379 4.175 1,6 474 3.849 1,8Calcomanías (tn) 154 13.250 2,0 69 14.402 1,0 41 15.600 0,6 28 11.080 0,3 31 11.733 0,4 66 11.128 0,7Impresos publicitarios, catálogoscomerciales y similares (tn) 945 6.272 5,9 364 4.337 1,6 245 6.937 1,7 265 6.781 1,8 255 8.083 2,1 252 8.929 2,3Naipes (unida<strong>de</strong>s) 3.272 380 1,2 878 460 0,4 825 204 0,2 493 398 0,2 740 278 0,2 978 420 0,4Los <strong>de</strong>más impresos (tn) 895 10.649 9,5 291 8.140 2,4 201 11.113 2,2 284 12.419 3,5 319 14.875 4,7 440 12.172 5,4RESTANTES 14,3 3,6 3,1 3,3 4,1 4,4TOTAL AGREGACIÓN MAYOR 645,3 170,6 157,0 155,8 176,4 198,283
BANCO CENTRAL DE CHILEIMPORTACIÓN DE LOS PRINCIPALES PRODUCTOS CLASIFICADOS DE ACUERDO CON LA CIIU<strong>Cuarto</strong> Trimestre 2006INDUSTRIA QUÍMICAValor en millones <strong>de</strong> US$ cifCLAVE 350Principales productos20052006AñoIV <strong>trimestre</strong> I <strong>trimestre</strong> II <strong>trimestre</strong> III <strong>trimestre</strong> IV <strong>trimestre</strong>Cantidad Precio Valor Cantidad Precio Valor Cantidad Precio Valor Cantidad Precio Valor Cantidad Precio Valor Cantidad Precio Valor(US$) (US$) (US$) (US$) (US$) (US$)Químicos básicosFósforo (tn) 1.391 2.409 3,4 147 2.538 0,4 573 2.514 1,4 371 2.104 0,8 143 2.376 0,3 714 1.972 1,4Ácido sulfúrico (miles <strong>de</strong> toneladas) 553 57.032 31,5 147 56.296 8,3 175 57.688 10,1 135 60.510 8,2 136 53.004 7,2 176 58.279 10,2Ácido fosfórico (tn) 11.487 673 7,7 2.470 682 1,7 1.443 699 1,0 2.056 621 1,3 2.624 630 1,7 3.266 625 2,0Los <strong>de</strong>más ácidos inorgánicos (tn) 2.669 747 2,0 571 755 0,4 735 822 0,6 619 796 0,5 575 785 0,5 985 585 0,6Anhídrido silícico (tn) 4.350 880 3,8 582 1.222 0,7 890 1.000 0,9 1.009 940 0,9 748 1.098 0,8 1.297 755 1,0Disulfuro <strong>de</strong> carbono (tn) 2.960 537 1,6 789 556 0,4 298 573 0,2 219 565 0,1 212 548 0,1 174 574 0,1Amoníaco anhidro (tn) 174.995 331 57,9 51.069 385 19,7 49.349 408 20,1 67.626 362 24,5 49.815 309 15,4 34.003 340 11,5Soda cáustica, en estado sólido (tn) 12.566 427 5,4 3.597 421 1,5 1.982 426 0,8 3.809 405 1,5 1.938 422 0,8 3.594 402 1,4Soda cáustica, en disolución acuosa (tn) 69.905 436 30,4 11.250 499 5,6 12.402 507 6,3 21.499 468 10,1 17.234 412 7,1 23.015 374 8,6Hidróxido <strong>de</strong> potasio (tn) 4.963 470 2,3 1.630 423 0,7 1.387 554 0,8 1.502 537 0,8 1.493 516 0,8 1.318 601 0,8Óxido <strong>de</strong> zinc; peróxido <strong>de</strong> zinc (tn) 1.643 1.296 2,1 308 1.339 0,4 497 1.564 0,8 709 2.082 1,5 617 2.526 1,6 431 2.480 1,1Trióxido <strong>de</strong> cromo (tn) 1.426 1.740 2,5 312 1.994 0,6 289 1.973 0,6 473 1.888 0,9 256 2.024 0,5 59 2.118 0,1Óxido e hidróxido <strong>de</strong> cobre (tn) 1.232 3.436 4,2 166 3.365 0,6 383 4.328 1,7 416 5.131 2,1 312 6.338 2,0 164 6.973 1,1Clorato <strong>de</strong> sodio (tn) 3.671 393 1,4 730 388 0,3 1.446 420 0,6 5.092 452 2,3 6.508 537 3,5 7.038 537 3,8Sulfuro <strong>de</strong> sodio ácido (tn) 67.194 424 28,5 21.169 490 10,4 17.218 535 9,2 9.304 550 5,1 19.064 554 10,6 18.942 477 9,0Ditionito y sulfoxilato <strong>de</strong> sodio (tn) 1.388 935 1,3 241 856 0,2 645 950 0,6 739 1.064 0,8 445 969 0,4 265 982 0,3Sulfito <strong>de</strong> sodio (tn) 4.822 497 2,4 1.407 483 0,7 914 556 0,5 1.432 470 0,7 1.291 525 0,7 1.461 524 0,8Los <strong>de</strong>más sulfatos (tn) 7.059 1.470 10,4 2.413 1.057 2,6 1.982 1.080 2,1 3.373 1.361 4,6 7.583 1.394 10,6 6.099 1.445 8,8Fosfato <strong>de</strong> calcio (tn) 37.652 302 11,4 9.084 318 2,9 11.523 322 3,7 11.308 338 3,8 12.079 353 4,3 13.711 347 4,8Tripolifosfato <strong>de</strong> sodio (tn) 27.637 698 19,3 8.248 664 5,5 5.397 663 3,6 7.231 682 4,9 7.109 654 4,7 8.096 687 5,6Ceniza <strong>de</strong> soda pesada (tn) 197.448 165 32,6 43.448 168 7,3 66.221 172 11,4 43.906 174 7,6 58.880 174 10,3 47.716 176 8,4Carbonato <strong>de</strong> calcio (tn) 37.644 153 5,8 4.071 285 1,2 4.492 281 1,3 22.956 88 2,0 4.626 178 0,8 3.104 299 0,9Cianuro y oxicianuro <strong>de</strong> sodio (tn) 6.827 973 6,6 680 1.105 0,8 4.697 963 4,5 2.592 974 2,5 2.830 1.113 3,2 3.015 1.242 3,7Perborato (tn) 206 840 0,2 0 11.391 0,0 0 11.500 0,0 0 12.667 0,0 1 3.445 0,0 0 14.500 0,0Agua oxigenada (tn) 19.547 395 7,7 4.773 403 1,9 5.476 404 2,2 4.657 403 1,9 6.108 394 2,4 6.297 413 2,6Tolueno (tn) 4.261 792 3,4 1.147 893 1,0 1.438 779 1,1 1.159 969 1,1 831 1.067 0,9 1.517 921 1,4Xileno (tn) 10.499 807 8,5 2.352 840 2,0 3.402 810 2,8 2.725 846 2,3 2.028 1.046 2,1 2.865 1.020 2,9Estireno (tn) 24.347 1.249 30,4 6.080 1.288 7,8 4.640 1.201 5,6 4.942 1.185 5,9 4.388 1.231 5,4 5.580 1.379 7,7Derivados sulfonados <strong>de</strong> loshidrocarburos (tn) 18.164 1.110 20,2 5.132 1.134 5,8 4.326 1.169 5,1 3.677 1.173 4,3 3.564 1.154 4,1 4.953 1.279 6,3Los <strong>de</strong>más monoalcoholessaturados (tn) 4.943 1.255 6,2 1.348 1.262 1,7 1.837 1.129 2,1 686 1.256 0,9 505 1.632 0,8 630 1.496 0,9Alcohol isopropílico (tn) 7.060 1.099 7,8 1.320 1.110 1,5 1.410 1.013 1,4 1.292 1.053 1,4 1.646 1.032 1,7 1.018 1.074 1,184