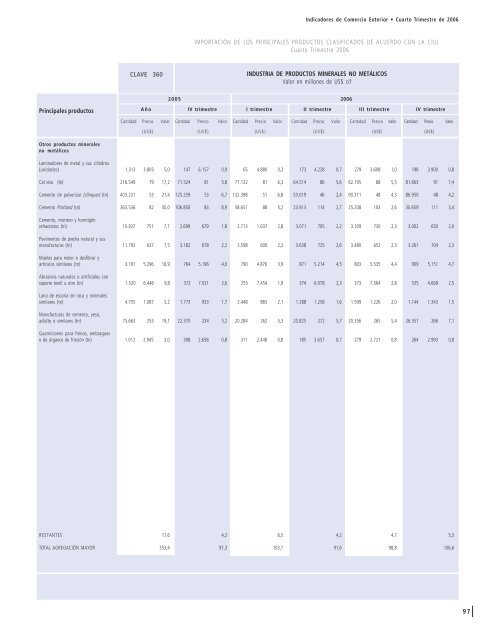
Indicadores <strong>de</strong> Comercio Exterior • <strong>Cuarto</strong> Trimestre <strong>de</strong> 2006IMPORTACIÓN DE LOS PRINCIPALES PRODUCTOS CLASIFICADOS DE ACUERDO CON LA CIIU<strong>Cuarto</strong> Trimestre 2006CLAVE 360INDUSTRIA DE PRODUCTOS MINERALES NO METÁLICOSValor en millones <strong>de</strong> US$ cifPrincipales productosAño2005 2006IV <strong>trimestre</strong> I <strong>trimestre</strong> II <strong>trimestre</strong> III <strong>trimestre</strong> IV <strong>trimestre</strong>Cantidad Precio Valor Cantidad Precio Valor Cantidad Precio Valor Cantidad Precio Valor Cantidad Precio Valor Cantidad Precio Valor(US$) (US$) (US$) (US$) (US$) (US$)Otros productos mineralesno metálicosLaminadores <strong>de</strong> metal y sus cilindros(unida<strong>de</strong>s) 1.313 3.805 5,0 147 6.157 0,9 65 4.880 0,3 173 4.228 0,7 279 3.608 1,0 198 3.900 0,8Cal viva (tn) 216.549 79 17,2 71.524 81 5,8 77.132 81 6,3 64.514 86 5,6 62.195 88 5,5 81.663 91 7,4Cemento sin pulverizar (clínquer) (tn) 403.231 53 21,4 125.259 53 6,7 132.398 51 6,8 53.019 46 2,4 90.311 48 4,3 86.950 48 4,2Cemento Portland (tn) 363.536 82 30,0 106.850 83 8,9 58.651 88 5,2 23.913 114 2,7 25.208 103 2,6 30.659 111 3,4Cemento, mortero y hormigónrefractarios (tn) 10.307 751 7,7 2.699 679 1,8 2.713 1.037 2,8 3.071 705 2,2 3.109 730 2,3 3.002 650 2,0Pavimentos <strong>de</strong> piedra natural y susmanufacturas (tn) 11.792 637 7,5 3.182 678 2,2 3.598 600 2,2 3.638 725 2,6 3.480 652 2,3 3.261 704 2,3Muelas para moler o <strong>de</strong>sfibrar yartículos similares (tn) 3.191 5.296 16,9 764 5.196 4,0 790 4.876 3,9 871 5.214 4,5 803 5.535 4,4 909 5.151 4,7Abrasivos naturales o artificiales consoporte textil u otro (tn) 1.520 6.446 9,8 372 7.031 2,6 255 7.454 1,9 374 6.078 2,3 373 7.564 2,8 535 4.668 2,5Lana <strong>de</strong> escoria <strong>de</strong> roca y mineralessimilares (tn) 4.755 1.087 5,2 1.773 933 1,7 2.448 865 2,1 1.288 1.258 1,6 1.599 1.226 2,0 1.144 1.343 1,5Manufacturas <strong>de</strong> cemento, yeso,asfalto o similares (tn) 75.663 253 19,1 22.370 234 5,2 20.284 262 5,3 20.825 272 5,7 20.356 265 5,4 26.557 266 7,1Guarniciones para frenos, embragueso <strong>de</strong> órganos <strong>de</strong> fricción (tn) 1.012 2.945 3,0 308 2.658 0,8 311 2.448 0,8 185 3.657 0,7 279 2.721 0,8 264 2.993 0,8RESTANTES 17,6 4,2 6,5 4,2 4,7 5,3TOTAL AGREGACIÓN MAYOR 353,4 97,3 103,7 91,6 98,8 106,697
BANCO CENTRAL DE CHILEIMPORTACIÓN DE LOS PRINCIPALES PRODUCTOS CLASIFICADOS DE ACUERDO CON LA CIIU<strong>Cuarto</strong> Trimestre 2006INDUSTRIA METÁLICA BÁSICAValor en millones <strong>de</strong> US$ cifCLAVE 370Principales productos20052006AñoIV <strong>trimestre</strong> I <strong>trimestre</strong> II <strong>trimestre</strong> III <strong>trimestre</strong> IV <strong>trimestre</strong>Cantidad Precio Valor Cantidad Precio Valor Cantidad Precio Valor Cantidad Precio Valor Cantidad Precio Valor Cantidad Precio Valor(US$) (US$) (US$) (US$) (US$) (US$)Hierro y aceroFerromanganeso (tn) 12.960 928 12,0 3.760 760 2,9 1.747 945 1,7 2.847 829 2,4 2.374 1.032 2,5 4.385 1.001 4,4Ferrosilicio (tn) 9.015 826 7,4 2.230 736 1,6 2.726 782 2,1 3.322 760 2,5 2.507 805 2,0 2.933 811 2,4Ferro-silico-manganeso (tn) 5.480 1.149 6,3 89 982 0,1 1.020 748 0,8 1.758 747 1,3 1.468 782 1,1 1.135 856 1,0Ferrocromo (tn) 4.043 1.330 5,4 1.104 1.158 1,3 725 1.259 0,9 716 1.454 1,0 1.132 1.345 1,5 715 1.308 0,9Las <strong>de</strong>más ferroaleaciones (tn) 2.604 2.338 6,1 424 2.300 1,0 669 2.647 1,8 621 3.434 2,1 164 5.356 0,9 265 5.491 1,5Granallas y polvo <strong>de</strong> fundición, <strong>de</strong>hierro o acero (tn) 1.990 770 1,5 565 817 0,5 420 722 0,3 532 710 0,4 616 785 0,5 644 755 0,5Planchas <strong>de</strong> acero sin alear laminadasen caliente (tn) 273.159 654 178,7 62.146 611 38,0 63.910 540 34,5 87.246 581 50,7 99.901 591 59,1 107.567 705 75,8Planchas <strong>de</strong> acero sin alear, laminadasen frío (tn) 32.568 730 23,8 6.718 668 4,5 7.454 587 4,4 14.327 626 9,0 17.276 720 12,4 11.480 700 8,0Productos laminados <strong>de</strong> acero sin alear,chapados o revestidos (tn) 94.733 912 86,4 26.060 823 21,4 37.292 802 29,9 31.460 834 26,2 44.481 985 43,8 54.688 984 53,8Flejes <strong>de</strong> acero sin alear, sin chapar,ni revestir (tn) 3.959 1.314 5,2 538 2.729 1,5 718 2.400 1,7 334 1.119 0,4 1.420 800 1,1 4.245 687 2,9Productos laminados planos <strong>de</strong> acerosin alear, chapados o revestidos (tn) 5.864 1.231 7,2 1.467 1.214 1,8 1.188 1.270 1,5 922 1.180 1,1 2.212 1.060 2,3 1.787 1.204 2,2Alambrón <strong>de</strong> acero sin alear (tn) 76.119 469 35,7 27.804 439 12,2 16.742 477 8,0 19.103 463 8,8 1.265 615 0,8 1.751 609 1,1Barras <strong>de</strong> acero sin alear (tn) 80.797 532 43,0 27.002 509 13,7 14.051 562 7,9 14.630 536 7,8 18.721 617 11,6 20.916 622 13,0Perfiles <strong>de</strong> acero sin alear (tn) 43.058 675 29,1 12.276 644 7,9 9.728 671 6,5 9.421 669 6,3 11.022 746 8,2 8.890 795 7,1Acero inoxidable (tn) 20.312 3.387 68,8 4.630 3.258 15,1 5.639 3.178 17,9 6.153 2.564 15,8 5.019 3.264 16,4 5.173 3.987 20,6Planchas <strong>de</strong> acero aleado (tn) 27.344 1.390 38,0 5.672 1.770 10,0 9.760 1.475 14,4 7.740 1.509 11,7 5.857 1.562 9,1 9.052 1.514 13,7Flejes <strong>de</strong> acero aleado (tn) 1.796 2.491 4,5 520 3.038 1,6 206 3.492 0,7 358 3.216 1,2 365 3.476 1,3 357 3.822 1,4Barras <strong>de</strong> acero aleado (tn) 101.980 620 63,2 26.827 587 15,7 40.599 583 23,7 31.830 598 19,0 18.063 711 12,8 18.881 681 12,9Carriles (rieles) <strong>de</strong> acero (tn) 13.969 1.073 15,0 417 1.711 0,7 2.134 825 1,8 3.146 860 2,7 806 1.485 1,2 1.019 1.045 1,1Los <strong>de</strong>más elementos para víaférrea (tn) 6.643 3.238 21,5 1.123 4.122 4,6 484 2.112 1,0 310 2.466 0,8 682 2.547 1,7 591 2.304 1,4Tubos <strong>de</strong> acero (tn) 71.989 1.776 127,9 16.982 1.956 33,2 63.224 1.445 91,4 19.828 1.367 27,1 17.057 1.601 27,3 33.932 1.282 43,5Accesorios <strong>de</strong> acero para tubería (tn) 6.447 6.280 40,5 2.052 7.015 14,4 1.720 7.750 13,3 2.182 5.037 11,0 1.734 6.133 10,6 2.994 4.204 12,6Bolas <strong>de</strong> acero y artículos similarespara molinos (tn) 24.817 687 17,0 4.506 719 3,2 5.193 659 3,4 6.469 693 4,5 6.772 677 4,6 5.556 785 4,4Las <strong>de</strong>más manufacturas mol<strong>de</strong>adas<strong>de</strong> fundición, <strong>de</strong> hierro o acero (tn) 2.923 2.880 8,4 688 3.131 2,2 896 2.639 2,4 847 2.874 2,4 867 2.751 2,4 571 2.793 1,6Metales no ferrososHidróxido <strong>de</strong> aluminio (tn) 6.675 364 2,4 928 360 0,3 6.256 315 2,0 1.088 490 0,5 1.464 463 0,7 5.445 409 2,2Desperdicios y <strong>de</strong>sechos <strong>de</strong> cobre (tn) 925 2.046 1,9 138 2.494 0,3 109 2.963 0,3 522 4.299 2,2 252 4.977 1,3 449 5.295 2,498