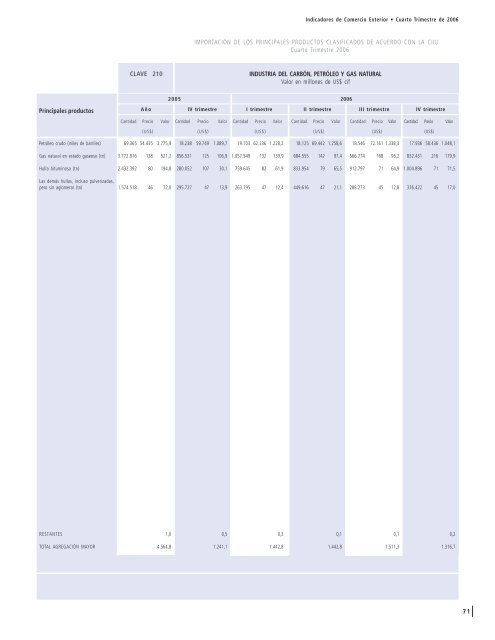
Indicadores <strong>de</strong> Comercio Exterior • <strong>Cuarto</strong> Trimestre <strong>de</strong> 2006IMPORTACIÓN DE LOS PRINCIPALES PRODUCTOS CLASIFICADOS DE ACUERDO CON LA CIIU<strong>Cuarto</strong> Trimestre 2006CLAVE 210INDUSTRIA DEL CARBÓN, PETRÓLEO Y GAS NATURALValor en millones <strong>de</strong> US$ cifPrincipales productosAño2005 2006IV <strong>trimestre</strong> I <strong>trimestre</strong> II <strong>trimestre</strong> III <strong>trimestre</strong> IV <strong>trimestre</strong>Cantidad Precio Valor Cantidad Precio Valor Cantidad Precio Valor Cantidad Precio Valor Cantidad Precio Valor Cantidad Precio Valor(US$) (US$) (US$) (US$) (US$) (US$)Petróleo crudo (miles <strong>de</strong> barriles) 69.365 54.435 3.775,9 18.238 59.749 1.089,7 19.703 62.336 1.228,2 18.125 69.442 1.258,6 18.546 72.161 1.338,3 17.936 58.436 1.048,1Gas natural en estado gaseoso (tn) 3.772.816 138 521,2 856.531 125 106,9 1.057.549 132 139,9 684.555 142 97,4 566.774 168 95,2 832.431 216 179,9Hulla bituminosa (tn) 2.432.392 80 194,8 280.052 107 30,1 759.645 82 61,9 833.954 79 65,5 912.797 71 64,9 1.004.896 71 71,5Las <strong>de</strong>más hullas, incluso pulverizadas,pero sin aglomerar (tn) 1.574.518 46 72,0 295.727 47 13,9 263.795 47 12,4 449.616 47 21,1 288.273 45 12,8 376.422 45 17,0RESTANTES 1,0 0,5 0,3 0,1 0,1 0,2TOTAL AGREGACIÓN MAYOR 4.564,8 1.241,1 1.442,8 1.442,8 1.511,3 1.316,771
BANCO CENTRAL DE CHILEIMPORTACIÓN DE LOS PRINCIPALES PRODUCTOS CLASIFICADOS DE ACUERDO CON LA CIIU<strong>Cuarto</strong> Trimestre 2006INDUSTRIA DE LA MINERÍA METÁLICA Y NO METÁLICAValor en millones <strong>de</strong> US$ cifCLAVES 220-230-240Principales productos20052006AñoIV <strong>trimestre</strong> I <strong>trimestre</strong> II <strong>trimestre</strong> III <strong>trimestre</strong> IV <strong>trimestre</strong>Cantidad Precio Valor Cantidad Precio Valor Cantidad Precio Valor Cantidad Precio Valor Cantidad Precio Valor Cantidad Precio Valor(US$) (US$) (US$) (US$) (US$) (US$)Minería metálicaMineral <strong>de</strong> cobre (tn) 73.567 1.075 79,1 15.063 1.058 15,9 34.382 1.298 44,6 21.373 1.767 37,8 44.021 2.057 90,6 26.701 1.841 49,1Mineral <strong>de</strong> aluminio y susconcentrados (tn) 46.516 61 2,9 277 231 0,1 2.773 284 0,8 332 231 0,1 209 258 0,1 2.402 303 0,7Mineral <strong>de</strong> cromo (tn) 12.850 292 3,8 6.835 293 2,0 3.129 330 1,0 2.395 333 0,8 1.328 284 0,4 1.549 318 0,5Concentrado sin tostar<strong>de</strong> molib<strong>de</strong>no (tn) 20.990 34.132 716,4 5.460 33.366 182,2 5.243 23.501 123,2 4.539 24.088 109,3 4.654 27.992 130,3 7.045 26.410 186,0Minería no metálicaAzufre (tn) 23.482 106 2,5 12.450 112 1,4 2.709 112 0,3 2.314 121 0,3 2.405 116 0,3 4.893 97 0,5Caolín (tn) 16.989 240 4,1 3.102 284 0,9 3.236 306 1,0 7.555 201 1,5 2.826 230 0,6 1.924 349 0,7Bentonita (tn) 4.912 230 1,1 1.473 213 0,3 1.332 232 0,3 1.460 293 0,4 1.747 203 0,4 2.088 307 0,6Creta (tn) 22.277 91 2,0 6.565 94 0,6 6.543 81 0,5 6.786 81 0,6 7.395 80 0,6 9.340 75 0,7Harina silícea fósil (tn) 12.099 76 0,9 3.683 89 0,3 139 617 0,1 2.109 97 0,2 4.228 100 0,4 4.173 97 0,4Dolomita sin calcinar (tn) 106.994 45 4,8 11.647 73 0,9 43.490 44 1,9 13.841 71 1,0 42.378 42 1,8 9.841 83 0,8Magnesita calcinada a muerte (tn) 8.410 365 3,1 194 341 0,1 5.155 317 1,6 4.308 320 1,4 1.339 405 0,5 2.681 359 1,0Esteatita talco triturado (tn) 10.065 313 3,1 2.613 301 0,8 2.685 290 0,8 2.352 313 0,7 2.464 297 0,7 3.054 329 1,0Borato natural (tn) 1.154 269 0,3 251 297 0,1 224 329 0,1 40 26 0,0 112 330 0,0 - - -Abono <strong>de</strong> origen animal o vegetal (tn) 1.375 2.011 2,8 624 1.435 0,9 431 774 0,3 117 739 0,1 528 1.706 0,9 500 3.266 1,6Arena natural (tn) 5.776 219 1,3 1.224 224 0,3 2.476 229 0,6 2.330 186 0,4 2.052 230 0,5 2.342 219 0,5RESTANTES 45,9 5,1 12,9 22,0 9,8 8,5TOTAL AGREGACIÓN MAYOR 874,2 211,9 190,1 176,5 237,9 252,872