Cuarto trimestre - Centro de Documentación FONACIT
Cuarto trimestre - Centro de Documentación FONACIT
Cuarto trimestre - Centro de Documentación FONACIT

Create successful ePaper yourself
Turn your PDF publications into a flip-book with our unique Google optimized e-Paper software.
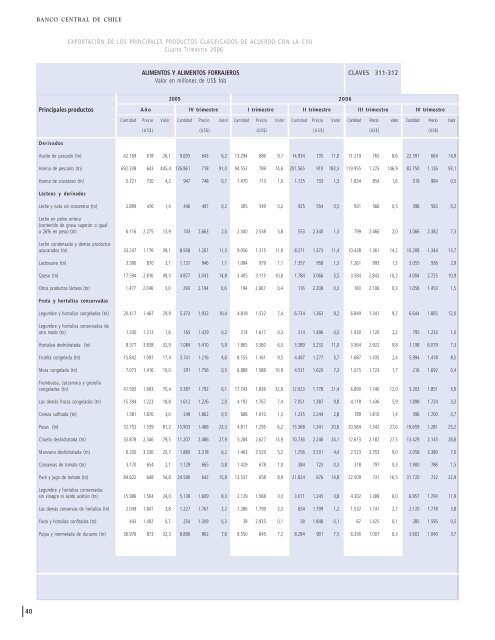
BANCO CENTRAL DE CHILEEXPORTACIÓN DE LOS PRINCIPALES PRODUCTOS CLASIFICADOS DE ACUERDO CON LA CIIU<strong>Cuarto</strong> Trimestre 2006ALIMENTOS Y ALIMENTOS FORRAJEROSValor en millones <strong>de</strong> US$ fobCLAVES 311-312Principales productos20052006AñoIV <strong>trimestre</strong> I <strong>trimestre</strong> II <strong>trimestre</strong> III <strong>trimestre</strong> IV <strong>trimestre</strong>Cantidad Precio Valor Cantidad Precio Valor Cantidad Precio Valor Cantidad Precio Valor Cantidad Precio Valor Cantidad Precio Valor(US$) (US$) (US$) (US$) (US$) (US$)DerivadosAceite <strong>de</strong> pescado (tn) 42.169 618 26,1 9.693 643 6,2 13.294 686 9,1 14.934 735 11,0 11.219 765 8,6 22.397 664 14,9Harina <strong>de</strong> pescado (tn) 692.338 643 445,4 126.861 718 91,0 94.553 789 74,6 201.565 910 183,5 119.955 1.225 146,9 82.750 1.126 93,1Harina <strong>de</strong> crustáceo (tn) 5.721 730 4,2 947 748 0,7 1.470 713 1,0 1.725 733 1,3 1.834 854 1,6 519 984 0,5Lácteos y <strong>de</strong>rivadosLeche y nata sin concentrar (tn) 2.899 476 1,4 446 497 0,2 305 549 0,2 925 554 0,5 931 566 0,5 398 583 0,2Leche en polvo entera(contenido <strong>de</strong> grasa superior o iguala 26% en peso) (tn) 6.116 2.275 13,9 743 2.663 2,0 2.300 2.538 5,8 553 2.340 1,3 799 2.466 2,0 3.066 2.382 7,3Leche con<strong>de</strong>nsada y <strong>de</strong>más productosazucarados (tn) 33.247 1.176 39,1 8.938 1.267 11,3 9.056 1.315 11,9 8.271 1.373 11,4 10.428 1.361 14,2 10.208 1.344 13,7Lactosuero (tn) 3.590 870 3,1 1.137 946 1,1 1.084 979 1,1 1.357 958 1,3 1.261 993 1,3 3.055 936 2,9Queso (tn) 17.594 2.816 49,5 4.877 3.043 14,8 3.405 3.115 10,6 1.784 3.066 5,5 3.584 2.842 10,2 4.004 2.725 10,9Otros productos lácteos (tn) 1.477 2.046 3,0 293 2.194 0,6 194 2.067 0,4 116 2.208 0,3 160 2.106 0,3 1.056 1.453 1,5Fruta y hortaliza conservadasLegumbre y hortaliza congeladas (tn) 20.417 1.467 29,9 5.373 1.932 10,4 4.818 1.532 7,4 6.734 1.363 9,2 6.849 1.341 9,2 6.644 1.805 12,0Legumbre y hortaliza conservadas <strong>de</strong>otro modo (tn) 1.330 1.213 1,6 165 1.429 0,2 214 1.617 0,3 314 1.496 0,5 1.930 1.120 2,2 795 1.233 1,0Hortaliza <strong>de</strong>shidratada (tn) 8.577 3.838 32,9 1.084 5.410 5,9 1.865 3.360 6,3 3.389 3.232 11,0 3.364 2.922 9,8 1.198 6.079 7,3Frutilla congelada (tn) 15.842 1.097 17,4 3.741 1.216 4,6 8.155 1.161 9,5 4.497 1.277 5,7 1.687 1.435 2,4 5.994 1.418 8,5Mora congelada (tn) 7.073 1.416 10,0 291 1.756 0,5 6.889 1.588 10,9 4.531 1.620 7,3 1.015 1.723 1,7 216 1.692 0,4Frambuesa, zarzamora y grosellacongeladas (tn) 41.593 1.693 70,4 3.387 1.792 6,1 17.743 1.836 32,6 12.023 1.778 21,4 6.890 1.740 12,0 3.203 1.851 5,9Las <strong>de</strong>más frutas congeladas (tn) 15.394 1.223 18,8 1.612 1.226 2,0 4.192 1.767 7,4 7.051 1.387 9,8 4.118 1.436 5,9 1.898 1.724 3,3Cereza sulfitada (tn) 1.581 1.876 3,0 249 1.862 0,5 688 1.910 1,3 1.235 2.244 2,8 789 1.810 1,4 396 1.700 0,7Pasas (tn) 52.752 1.539 81,2 15.903 1.466 23,3 4.811 1.295 6,2 15.368 1.341 20,6 20.584 1.342 27,6 19.659 1.281 25,2Ciruela <strong>de</strong>shidratada (tn) 33.878 2.346 79,5 11.207 2.486 27,9 5.284 2.627 13,9 10.736 2.246 24,1 12.613 2.182 27,5 13.429 2.145 28,8Manzana <strong>de</strong>shidratada (tn) 6.200 3.336 20,7 1.860 3.318 6,2 1.463 3.529 5,2 1.256 3.531 4,4 2.523 3.553 9,0 2.058 3.380 7,0Conservas <strong>de</strong> tomate (tn) 3.170 654 2,1 1.129 665 0,8 1.429 678 1,0 384 723 0,3 318 797 0,3 1.900 786 1,5Puré y jugo <strong>de</strong> tomate (tn) 84.622 648 54,8 24.590 642 15,8 13.537 658 8,9 21.824 676 14,8 22.509 731 16,5 31.720 722 22,9Legumbre y hortaliza conservadassin vinagre ni ácido acético (tn) 15.986 1.504 24,0 5.136 1.609 8,3 2.129 1.568 3,3 3.071 1.245 3,8 4.302 1.389 6,0 6.957 1.704 11,9Las <strong>de</strong>más conservas <strong>de</strong> hortaliza (tn) 2.049 1.841 3,8 1.227 1.761 2,2 1.286 1.799 2,3 654 1.799 1,2 1.532 1.741 2,7 2.120 1.778 3,8Fruta y hortaliza confitadas (tn) 443 1.492 0,7 254 1.309 0,3 39 2.935 0,1 28 1.848 0,1 67 1.425 0,1 285 1.595 0,5Pulpa y mermelada <strong>de</strong> durazno (tn) 36.976 873 32,3 8.806 862 7,6 8.550 845 7,2 8.284 901 7,5 6.290 1.007 6,3 3.602 1.040 3,740