Indicadores <strong>de</strong> Comercio Exterior • <strong>Cuarto</strong> Trimestre <strong>de</strong> 2006IMPORTACIÓN DE LOS PRINCIPALES PRODUCTOS CLASIFICADOS DE ACUERDO CON LA CIIU<strong>Cuarto</strong> Trimestre 2006CLAVE 310INDUSTRIA DE PRODUCTOS ALIMENTICIOS, BEBIDAS Y TABACOValor en millones <strong>de</strong> US$ cifPrincipales productosAño2005 2006IV <strong>trimestre</strong> I <strong>trimestre</strong> II <strong>trimestre</strong> III <strong>trimestre</strong> IV <strong>trimestre</strong>Cantidad Precio Valor Cantidad Precio Valor Cantidad Precio Valor Cantidad Precio Valor Cantidad Precio Valor Cantidad Precio Valor(US$) (US$) (US$) (US$) (US$) (US$)Conservas <strong>de</strong> palmito (tn) 2.876 1.842 5,3 701 1.848 1,3 803 1.907 1,5 948 2.011 1,9 1.059 2.099 2,2 1.099 2.287 2,5Jugo <strong>de</strong> naranja (tn) 3.805 944 3,6 1.076 1.019 1,1 634 1.211 0,8 823 1.479 1,2 914 1.584 1,4 1.099 1.714 1,9Los <strong>de</strong>más jugos <strong>de</strong> fruta (tn) 8.222 904 7,4 2.749 852 2,3 2.141 905 1,9 2.086 851 1,8 1.164 1.287 1,5 2.021 1.252 2,5Extracto, esencia y concentrado,<strong>de</strong> café (tn) 1.113 4.618 5,1 223 3.682 0,8 250 4.790 1,2 658 4.854 3,2 220 6.512 1,4 224 5.812 1,3Levadura (tn) 2.705 2.672 7,2 797 2.015 1,6 969 4.020 3,9 913 2.789 2,5 731 2.009 1,5 959 2.920 2,8Salsa y preparaciones para salsa (tn) 1.211 2.001 2,4 323 1.939 0,6 346 2.313 0,8 356 1.892 0,7 426 1.941 0,8 327 2.133 0,7Salsa <strong>de</strong> tomate, preparada (tn) 1.136 1.239 1,4 349 1.290 0,4 302 1.349 0,4 313 1.380 0,4 220 1.465 0,3 177 1.517 0,3Condimentos y sazonadorescompuestos (tn) 448 3.455 1,5 111 4.388 0,5 101 3.974 0,4 123 2.784 0,3 107 4.322 0,5 152 3.259 0,5Preparaciones para sopas (tn) 583 1.989 1,2 132 2.121 0,3 83 2.214 0,2 192 2.247 0,4 160 2.330 0,4 104 2.555 0,3Concentrado <strong>de</strong> proteínas y sustanciasproteicas texturadas (tn) 6.615 1.942 12,8 2.125 2.439 5,2 2.578 1.848 4,8 1.746 1.689 2,9 2.934 1.270 3,7 5.831 836 4,9Polvo para budín, gelatina y similares (tn) 1.425 1.440 2,1 191 2.094 0,4 180 2.230 0,4 115 2.230 0,3 41 3.171 0,1 36 2.778 0,1Extracto para elaborar bebidas (tn) 374 6.456 2,4 73 5.889 0,4 101 6.569 0,7 79 7.426 0,6 137 7.338 1,0 72 10.307 0,7Las <strong>de</strong>más preparaciones alimenticias (tn) 14.121 2.052 29,0 3.889 1.987 7,7 4.034 2.166 8,7 5.124 2.198 11,3 4.177 2.410 10,1 5.061 2.551 12,9Salvado <strong>de</strong> maíz (tn) 868 88 0,1 252 88 0,0 282 105 0,0 300 361 0,1 330 361 0,1 - - -Tortas y residuos <strong>de</strong> soya (tn) 627.362 233 146,1 183.248 237 43,5 184.152 245 45,2 183.553 219 40,2 149.366 228 34,1 222.437 231 51,4Tortas y residuos <strong>de</strong> girasol (tn) 60.218 141 8,5 19.909 165 3,3 10.537 162 1,7 11.413 126 1,4 7.220 154 1,1 23.465 146 3,4Ácido oleico (tn) 1.795 813 1,5 418 850 0,4 683 787 0,5 551 860 0,5 494 903 0,4 562 897 0,5Harina y pelets <strong>de</strong> carne, impropiospara alimentación humana (tn) 13.685 316 4,3 3.501 349 1,2 6.952 372 2,6 7.026 342 2,4 8.294 352 2,9 9.203 368 3,4Harina <strong>de</strong> pescado, impropia paraalimentación humana (tn) 8.104 655 5,3 2.079 713 1,5 14.878 748 11,1 4.812 1.118 5,4 14.273 1.357 19,4 9.187 1.151 10,6Té (tn) 17.878 1.233 22,0 3.100 1.587 4,9 4.316 1.223 5,3 5.903 1.285 7,6 3.194 1.199 3,8 5.715 1.651 9,4Condimentos y especias (tn) 2.072 1.903 3,9 443 1.980 0,9 157 2.259 0,4 475 2.050 1,0 317 2.275 0,7 450 2.593 1,2Arroz semiblanqueado o blanqueado,incluso pulido o glaseado (tn) 76.607 341 26,1 32.362 328 10,6 25.312 331 8,4 23.960 317 7,6 11.810 330 3,9 18.140 353 6,4Arroz partido (tn) 17.681 242 4,3 9.069 257 2,3 7.395 248 1,8 2.698 247 0,7 6.865 242 1,7 6.506 243 1,6Almidón <strong>de</strong> maíz (tn) 10.475 248 2,6 2.549 266 0,7 4.332 254 1,1 2.035 256 0,5 2.996 266 0,8 3.273 260 0,9Gluten <strong>de</strong> trigo (tn) 3.943 955 3,8 1.418 952 1,3 500 914 0,5 775 950 0,7 900 942 0,8 951 1.021 1,0Jugos y extractos vegetales (tn) 401 11.069 4,4 115 10.826 1,2 107 13.485 1,4 77 7.691 0,6 98 10.336 1,0 103 13.134 1,3Productos para alimentaciónanimalMaterias y <strong>de</strong>sperdicios vegetales paraalimentación animal (tn) 30.013 251 7,5 6.627 254 1,7 8.127 253 2,1 6.459 266 1,7 1.617 275 0,4 2.658 275 0,7Alimentos para perro o gato (tn) 74.879 523 39,1 17.364 527 9,1 18.547 527 9,8 21.612 554 12,0 20.639 580 12,0 14.883 586 8,775
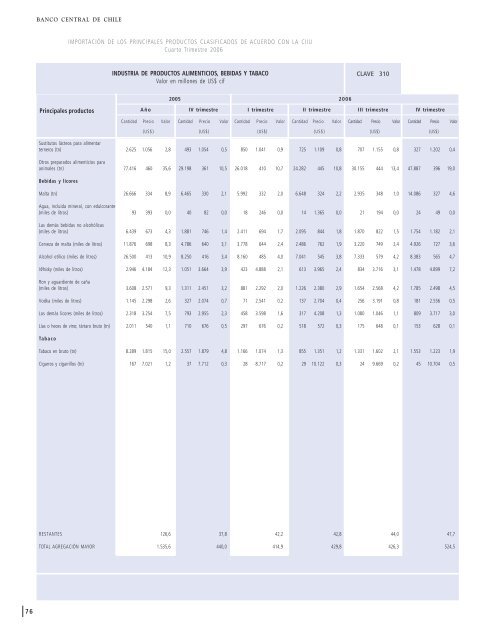
BANCO CENTRAL DE CHILEIMPORTACIÓN DE LOS PRINCIPALES PRODUCTOS CLASIFICADOS DE ACUERDO CON LA CIIU<strong>Cuarto</strong> Trimestre 2006INDUSTRIA DE PRODUCTOS ALIMENTICIOS, BEBIDAS Y TABACOValor en millones <strong>de</strong> US$ cifCLAVE 310Principales productos20052006AñoIV <strong>trimestre</strong> I <strong>trimestre</strong> II <strong>trimestre</strong> III <strong>trimestre</strong> IV <strong>trimestre</strong>Cantidad Precio Valor Cantidad Precio Valor Cantidad Precio Valor Cantidad Precio Valor Cantidad Precio Valor Cantidad Precio Valor(US$) (US$) (US$) (US$) (US$) (US$)Sustitutos lácteos para alimentarterneros (tn) 2.625 1.056 2,8 493 1.054 0,5 850 1.041 0,9 725 1.109 0,8 707 1.155 0,8 327 1.202 0,4Otros preparados alimenticios paraanimales (tn) 77.416 460 35,6 29.198 361 10,5 26.018 410 10,7 24.282 445 10,8 30.155 444 13,4 47.887 396 19,0Bebidas y licoresMalta (tn) 26.666 334 8,9 6.465 330 2,1 5.992 332 2,0 6.648 324 2,2 2.935 348 1,0 14.086 327 4,6Agua, incluida mineral, con edulcorante(miles <strong>de</strong> litros) 93 393 0,0 40 82 0,0 18 246 0,0 14 1.365 0,0 21 194 0,0 24 49 0,0Las <strong>de</strong>más bebidas no alcohólicas(miles <strong>de</strong> litros) 6.439 673 4,3 1.881 746 1,4 2.411 694 1,7 2.095 844 1,8 1.870 822 1,5 1.754 1.182 2,1Cerveza <strong>de</strong> malta (miles <strong>de</strong> litros) 11.876 698 8,3 4.786 640 3,1 3.778 644 2,4 2.486 762 1,9 3.220 749 2,4 4.926 727 3,6Alcohol etílico (miles <strong>de</strong> litros) 26.500 413 10,9 8.250 416 3,4 8.160 485 4,0 7.041 545 3,8 7.333 579 4,2 8.383 565 4,7Whisky (miles <strong>de</strong> litros) 2.946 4.184 12,3 1.051 3.664 3,9 423 4.888 2,1 613 3.965 2,4 834 3.716 3,1 1.478 4.899 7,2Ron y aguardiente <strong>de</strong> caña(miles <strong>de</strong> litros) 3.608 2.571 9,3 1.311 2.451 3,2 881 2.292 2,0 1.226 2.380 2,9 1.654 2.568 4,2 1.785 2.498 4,5Vodka (miles <strong>de</strong> litros) 1.145 2.298 2,6 327 2.074 0,7 71 2.541 0,2 137 2.704 0,4 256 3.191 0,8 181 2.556 0,5Los <strong>de</strong>más licores (miles <strong>de</strong> litros) 2.318 3.254 7,5 793 2.955 2,3 458 3.598 1,6 317 4.208 1,3 1.080 1.046 1,1 809 3.717 3,0Lías o heces <strong>de</strong> vino; tártaro bruto (tn) 2.011 540 1,1 710 676 0,5 297 676 0,2 518 572 0,3 175 648 0,1 153 628 0,1TabacoTabaco en bruto (tn) 8.289 1.815 15,0 2.557 1.879 4,8 1.166 1.074 1,3 855 1.351 1,2 1.331 1.602 2,1 1.553 1.223 1,9Cigarros y cigarrillos (tn) 167 7.021 1,2 37 7.712 0,3 28 8.717 0,2 29 10.122 0,3 24 9.669 0,2 45 10.704 0,5RESTANTES 126,6 37,8 42,2 42,8 44,0 47,7TOTAL AGREGACIÓN MAYOR 1.535,6 440,0 414,9 429,8 426,3 524,576