Indicadores <strong>de</strong> Comercio Exterior • <strong>Cuarto</strong> Trimestre <strong>de</strong> 2006EXPORTACIÓN DE LOS PRINCIPALES PRODUCTOS CLASIFICADOS DE ACUERDO CON LA CIIU<strong>Cuarto</strong> Trimestre 2006CLAVE 110AGRICULTURA, FRUTICULTURA Y GANADERÍAValor en millones <strong>de</strong> US$ fobPrincipales productosAño2005 2006IV <strong>trimestre</strong> I <strong>trimestre</strong> II <strong>trimestre</strong> III <strong>trimestre</strong> IV <strong>trimestre</strong>Cantidad Precio Valor Cantidad Precio Valor Cantidad Precio Valor Cantidad Precio Valor Cantidad Precio Valor Cantidad Precio Valor(US$) (US$) (US$) (US$) (US$) (US$)Fruta frescaNueces con cáscara (tn) 4.667 2.775 12,9 530 2.911 1,5 1 2.280 0,0 1.228 3.229 4,0 2.981 2.964 8,8 998 2.698 2,7Nueces sin cáscara (tn) 4.057 7.789 31,6 874 8.032 7,0 150 7.625 1,1 1.084 8.376 9,1 2.894 8.099 23,4 1.675 7.894 13,2Almendras con cáscara (tn) 432 4.961 2,1 86 5.253 0,5 - - - 725 4.049 2,9 29 4.127 0,1 12 4.183 0,0Almendras sin cáscara (tn) 5.735 7.909 45,4 1.396 8.229 11,5 390 7.290 2,8 667 6.194 4,1 1.858 6.149 11,4 531 6.858 3,6Paltas (tn) 136.412 1.217 165,9 59.087 1.213 71,7 3.697 1.190 4,4 0 4.231 0,0 26.784 1.345 36,0 90.143 1.161 104,6Naranjas (tn) 20.802 604 12,6 1.555 629 1,0 20 879 0,0 196 613 0,1 21.318 669 14,3 4.328 633 2,7Mandarinas, clementinas, wilkings (tn) 21.681 842 18,2 136 845 0,1 - - - 8.970 921 8,3 15.803 857 13,5 236 1.118 0,3Limones (tn) 35.025 591 20,7 68 718 0,0 1 1.428 0,0 9.731 936 9,1 22.242 621 13,8 1.206 667 0,8Uvas (tn) 738.469 1.237 913,5 38.309 1.959 75,1 476.577 1.257 598,9 303.079 1.116 338,1 3.592 940 3,4 53.413 1.893 101,1Manzanas (tn) 639.458 518 331,1 36.965 450 16,6 99.245 554 55,0 431.717 579 250,1 168.921 593 100,2 41.325 534 22,1Peras (tn) 126.774 584 74,0 1.992 540 1,1 53.902 632 34,1 53.642 596 32,0 13.537 582 7,9 785 614 0,5Damascos (tn) 2.495 1.330 3,3 1.753 1.204 2,1 595 1.076 0,6 - - - - - - 2.052 1.203 2,5Cerezas (tn) 17.916 3.837 68,8 14.218 3.848 54,7 8.259 3.915 32,3 22 5.003 0,1 - - - 14.182 4.118 58,4Nectarines (tn) 58.171 911 53,0 5.672 1.071 6,1 37.953 946 35,9 1.240 954 1,2 21 855 0,0 7.457 1.097 8,2Duraznos (tn) 51.382 774 39,8 6.348 1.034 6,6 40.744 844 34,4 1.946 771 1,5 6 1.114 0,0 7.745 1.046 8,1Ciruelas (tn) 95.032 900 85,6 1.827 1.167 2,1 64.964 955 62,0 13.364 1.039 13,9 15 467 0,0 2.013 1.089 2,2Frambuesas y moras frescas (tn) 5.288 5.450 28,8 963 6.146 5,9 2.807 6.501 18,2 692 7.193 5,0 14 1.539 0,0 631 6.380 4,0Arándanos (tn) 11.893 8.611 102,4 3.537 8.835 31,3 10.815 8.094 87,5 786 13.203 10,4 15 7.371 0,1 4.094 9.338 38,2Kiwis (tn) 131.543 815 107,2 1.150 1.038 1,2 3.128 1.122 3,5 116.995 827 96,7 26.158 921 24,1 2.241 1.157 2,6Las <strong>de</strong>más frutas frescas (tn) 9.799 1.026 10,0 1.086 1.405 1,5 2.341 1.236 2,9 2.218 1.288 2,9 2.030 999 2,0 2.722 850 2,3HortalizasPapas (tn) 495 535 0,3 5 839 0,0 10 771 0,0 229 494 0,1 724 587 0,4 23 419 0,0Tomates frescos (tn) 247 1.232 0,3 4 2.104 0,0 31 782 0,0 25 672 0,0 4 1.948 0,0 3 1.943 0,0Cebollas (tn) 54.555 289 15,8 73 266 0,0 14.206 429 6,1 25.048 239 6,0 1.262 391 0,5 323 761 0,2Ajos (tn) 5.603 1.064 6,0 1.106 1.204 1,3 3.152 1.111 3,5 335 973 0,3 0 2.923 0,0 954 1.092 1,0Achicorias (tn) 4.659 875 4,1 3 2.848 0,0 2.021 673 1,4 3.279 692 2,3 6 3.357 0,0 1 6.731 0,0Espárragos (tn) 1.591 1.677 2,7 1.547 1.669 2,6 6 1.762 0,0 0 4.000 0,0 0 4.000 0,0 683 1.554 1,1Pimiento, ají y similares (tn) 209 1.436 0,3 1 4.215 0,0 1 3.939 0,0 107 753 0,1 17 816 0,0 1 3.228 0,0Fréjol para consumo (tn) 1.695 627 1,1 159 692 0,1 188 677 0,1 1.136 663 0,8 1.487 511 0,8 644 528 0,3Orégano (tn) 2.265 2.321 5,3 497 2.220 1,1 488 2.365 1,2 522 2.545 1,3 452 2.461 1,1 325 2.566 0,8Lupino (tn) 21.029 494 10,4 5.171 481 2,5 1.425 537 0,8 3.159 458 1,4 7.940 325 2,6Las <strong>de</strong>más hortalizas frescas (tn) 393 851 0,3 30 1.510 0,0 120 423 0,1 142 860 0,1 188 1.183 0,2 36 672 0,0Nota: La <strong>de</strong>finición <strong>de</strong> las claves económicas se pue<strong>de</strong> consultar en el Indicadores <strong>de</strong> Comercio Exterior <strong>de</strong> enero <strong>de</strong> 2002.33
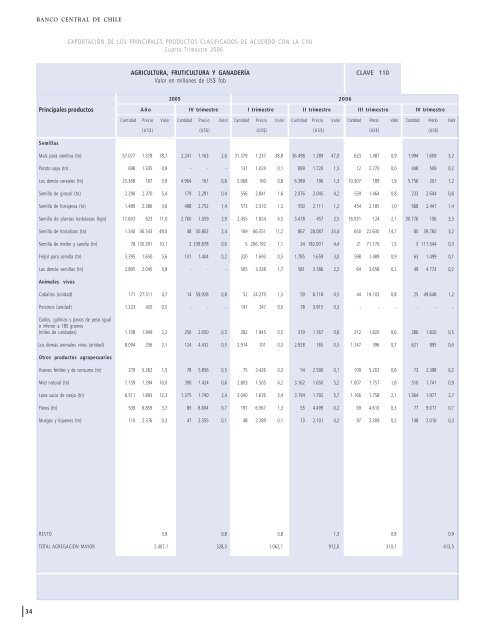
BANCO CENTRAL DE CHILEEXPORTACIÓN DE LOS PRINCIPALES PRODUCTOS CLASIFICADOS DE ACUERDO CON LA CIIU<strong>Cuarto</strong> Trimestre 2006AGRICULTURA, FRUTICULTURA Y GANADERÍAValor en millones <strong>de</strong> US$ fobCLAVE 110Principales productos20052006AñoIV <strong>trimestre</strong> I <strong>trimestre</strong> II <strong>trimestre</strong> III <strong>trimestre</strong> IV <strong>trimestre</strong>Cantidad Precio Valor Cantidad Precio Valor Cantidad Precio Valor Cantidad Precio Valor Cantidad Precio Valor Cantidad Precio Valor(US$) (US$) (US$) (US$) (US$) (US$)SemillasMaíz para siembra (tn) 57.077 1.378 78,7 2.241 1.163 2,6 31.379 1.237 38,8 36.498 1.289 47,0 623 1.487 0,9 1.994 1.609 3,2Poroto soya (tn) 698 1.335 0,9 - - - 131 1.024 0,1 899 1.720 1,5 12 2.770 0,0 448 509 0,2Los <strong>de</strong>más cereales (tn) 23.368 167 3,9 4.964 161 0,8 5.068 160 0,8 6.389 196 1,3 10.307 189 1,9 5.756 201 1,2Semilla <strong>de</strong> girasol (tn) 2.290 2.370 5,4 179 2.291 0,4 556 2.841 1,6 2.076 2.045 4,2 559 1.464 0,8 233 2.644 0,6Semilla <strong>de</strong> forrajeras (tn) 1.489 2.386 3,6 498 2.752 1,4 573 2.310 1,3 550 2.111 1,2 454 2.185 1,0 568 2.441 1,4Semilla <strong>de</strong> plantas herbáceas (kgn) 17.643 623 11,0 2.760 1.059 2,9 2.455 1.824 4,5 5.418 457 2,5 16.931 124 2,1 30.776 106 3,3Semilla <strong>de</strong> hortalizas (tn) 1.340 36.543 49,0 48 50.803 2,4 169 66.351 11,2 867 28.087 24,4 650 22.630 14,7 80 39.760 3,2Semilla <strong>de</strong> melón y sandía (tn) 78 130.391 10,1 2 339.878 0,6 5 206.192 1,1 24 182.001 4,4 21 71.170 1,5 3 111.544 0,3Fréjol para semilla (tn) 3.395 1.650 5,6 131 1.404 0,2 320 1.693 0,5 1.785 1.659 3,0 598 1.489 0,9 63 1.499 0,1Las <strong>de</strong>más semillas (tn) 2.895 2.045 5,9 - - - 505 3.338 1,7 581 3.786 2,2 64 3.658 0,2 49 4.773 0,2Animales vivosCaballos (unidad) 171 27.511 4,7 14 59.928 0,8 52 24.279 1,3 59 8.718 0,5 44 19.102 0,8 25 49.648 1,2Porcinos (unidad) 1.223 420 0,5 - - - 147 247 0,0 78 3.915 0,3 - - - - - -Gallos, gallinas y pavos <strong>de</strong> peso igualo inferior a 185 gramos(miles <strong>de</strong> unida<strong>de</strong>s) 1.108 1.949 2,2 250 2.050 0,5 282 1.945 0,5 319 1.767 0,6 312 1.820 0,6 286 1.830 0,5Los <strong>de</strong>más animales vivos (unidad) 8.094 256 2,1 124 4.432 0,5 2.914 101 0,3 2.928 165 0,5 1.747 396 0,7 621 895 0,6Otros productos agropecuariosHuevos fértiles y <strong>de</strong> consumo (tn) 279 5.262 1,5 78 5.856 0,5 75 3.426 0,3 54 2.590 0,1 109 5.202 0,6 73 2.398 0,2Miel natural (tn) 7.159 1.394 10,0 390 1.424 0,6 2.803 1.505 4,2 3.162 1.650 5,2 1.007 1.757 1,8 510 1.741 0,9Lana sucia <strong>de</strong> oveja (tn) 6.511 1.893 12,3 1.375 1.740 2,4 2.040 1.676 3,4 3.194 1.792 5,7 1.166 1.758 2,1 1.364 1.977 2,7Flores (tn) 539 6.859 3,7 85 8.604 0,7 197 6.567 1,3 55 4.499 0,2 69 4.610 0,3 77 9.017 0,7Musgos y líquenes (tn) 110 2.376 0,3 47 2.355 0,1 48 2.289 0,1 73 2.101 0,2 97 2.309 0,2 148 2.010 0,3RESTO 3,9 0,8 0,8 1,3 0,8 0,9TOTAL AGREGACIÓN MAYOR 2.407,1 328,3 1.062,1 912,0 310,1 413,534
- Page 1 and 2: Indicadores deComercio ExteriorCuar
- Page 3 and 4: I. Resumen del Comercio Exterior
- Page 5 and 6: BANCO CENTRAL DE CHILECUADRO 1 COME
- Page 7 and 8: II. Estudio
- Page 9 and 10: BANCO CENTRAL DE CHILEImportancia d
- Page 11 and 12: BANCO CENTRAL DE CHILECUADRO 2EXPOR
- Page 13 and 14: BANCO CENTRAL DE CHILEEvolución de
- Page 15 and 16: BANCO CENTRAL DE CHILEGRÁFICO 3 PA
- Page 17 and 18: BANCO CENTRAL DE CHILELa exportaci
- Page 19 and 20: BANCO CENTRAL DE CHILEANEXO 3EXPORT
- Page 21 and 22: BANCO CENTRAL DE CHILEANEXO 8EXPORT
- Page 23 and 24: Exportaciones
- Page 25: BANCO CENTRAL DE CHILEEXPORTACIONES
- Page 29 and 30: BANCO CENTRAL DE CHILEEXPORTACIÓN
- Page 31 and 32: BANCO CENTRAL DE CHILEEXPORTACIÓN
- Page 33 and 34: BANCO CENTRAL DE CHILEEXPORTACIÓN
- Page 35 and 36: BANCO CENTRAL DE CHILEEXPORTACIÓN
- Page 37 and 38: BANCO CENTRAL DE CHILEEXPORTACIÓN
- Page 39 and 40: BANCO CENTRAL DE CHILEEXPORTACIÓN
- Page 41 and 42: BANCO CENTRAL DE CHILEEXPORTACIÓN
- Page 43 and 44: BANCO CENTRAL DE CHILEEXPORTACIÓN
- Page 45 and 46: BANCO CENTRAL DE CHILEEXPORTACIÓN
- Page 47 and 48: BANCO CENTRAL DE CHILEEXPORTACIÓN
- Page 49 and 50: BANCO CENTRAL DE CHILEEXPORTACIÓN
- Page 51 and 52: BANCO CENTRAL DE CHILEEXPORTACIÓN
- Page 53 and 54: BANCO CENTRAL DE CHILE(Continuació
- Page 55 and 56: BANCO CENTRAL DE CHILE(Continuació
- Page 57 and 58: Importaciones
- Page 59 and 60: BANCO CENTRAL DE CHILEIMPORTACIONES
- Page 61 and 62: BANCO CENTRAL DE CHILEIMPORTACIÓN
- Page 63 and 64: BANCO CENTRAL DE CHILEIMPORTACIÓN
- Page 65 and 66: BANCO CENTRAL DE CHILEIMPORTACIÓN
- Page 67 and 68: BANCO CENTRAL DE CHILEIMPORTACIÓN
- Page 69 and 70: BANCO CENTRAL DE CHILEIMPORTACIÓN
- Page 71 and 72: BANCO CENTRAL DE CHILEIMPORTACIÓN
- Page 73 and 74: BANCO CENTRAL DE CHILEIMPORTACIÓN
- Page 75 and 76: BANCO CENTRAL DE CHILEIMPORTACIÓN
- Page 77 and 78:
BANCO CENTRAL DE CHILEIMPORTACIÓN
- Page 79 and 80:
BANCO CENTRAL DE CHILEIMPORTACIÓN
- Page 81 and 82:
BANCO CENTRAL DE CHILEIMPORTACIÓN
- Page 83 and 84:
BANCO CENTRAL DE CHILEIMPORTACIÓN
- Page 85 and 86:
BANCO CENTRAL DE CHILEIMPORTACIÓN
- Page 87 and 88:
BANCO CENTRAL DE CHILEIMPORTACIÓN
- Page 89 and 90:
BANCO CENTRAL DE CHILEIMPORTACIÓN
- Page 91 and 92:
BANCO CENTRAL DE CHILEIMPORTACIÓN
- Page 93 and 94:
BANCO CENTRAL DE CHILEIMPORTACIÓN
- Page 95 and 96:
BANCO CENTRAL DE CHILEIMPORTACIÓN
- Page 97 and 98:
BANCO CENTRAL DE CHILEIMPORTACIÓN
- Page 99 and 100:
BANCO CENTRAL DE CHILEIMPORTACIÓN
- Page 101 and 102:
BANCO CENTRAL DE CHILEIMPORTACIÓN
- Page 103 and 104:
BANCO CENTRAL DE CHILEIMPORTACIÓN
- Page 105 and 106:
BANCO CENTRAL DE CHILEIMPORTACIÓN
- Page 107 and 108:
BANCO CENTRAL DE CHILEIMPORTACIÓN
- Page 109 and 110:
BANCO CENTRAL DE CHILEIMPORTACIÓN
- Page 111 and 112:
BANCO CENTRAL DE CHILE(Continuació
- Page 113 and 114:
BANCO CENTRAL DE CHILE(Continuació
- Page 115 and 116:
Indicadores de Comercio Exterior
- Page 117 and 118:
Indicadores de Comercio Exterior
- Page 119 and 120:
Indicadores de Comercio Exterior
- Page 121 and 122:
Indicadores de Comercio Exterior
- Page 123 and 124:
Indicadores de Comercio Exterior
- Page 125 and 126:
Principales Productos Exportadose I
- Page 127 and 128:
Indicadores de Comercio Exterior
- Page 129 and 130:
Indicadores de Comercio Exterior
- Page 131 and 132:
Indicadores de Comercio Exterior
- Page 133 and 134:
Indicadores de Comercio Exterior
- Page 135 and 136:
Indicadores de Comercio Exterior
- Page 137 and 138:
Indicadores de Comercio Exterior
- Page 139 and 140:
Indicadores de Comercio Exterior
- Page 141 and 142:
Indicadores de Comercio Exterior
- Page 143 and 144:
Indicadores de Comercio Exterior
- Page 145 and 146:
Indicadores de Comercio Exterior
- Page 147 and 148:
Indicadores de Comercio Exterior
- Page 149 and 150:
Indicadores de Comercio Exterior
- Page 151 and 152:
Indicadores de Comercio Exterior
- Page 153 and 154:
Indicadores de Comercio Exterior
- Page 155 and 156:
Indicadores de Comercio Exterior
- Page 157 and 158:
Europa
- Page 159 and 160:
BANCO CENTRAL DE CHILEPRINCIPALES P
- Page 161 and 162:
BANCO CENTRAL DE CHILE(Continuació
- Page 163 and 164:
BANCO CENTRAL DE CHILE(Continuació
- Page 165 and 166:
BANCO CENTRAL DE CHILE(Continuació
- Page 167 and 168:
BANCO CENTRAL DE CHILE(Continuació
- Page 169 and 170:
BANCO CENTRAL DE CHILE(Continuació
- Page 171 and 172:
BANCO CENTRAL DE CHILE(Continuació
- Page 173 and 174:
BANCO CENTRAL DE CHILE(Continuació
- Page 175 and 176:
BANCO CENTRAL DE CHILE(Continuació
- Page 177 and 178:
BANCO CENTRAL DE CHILE(Continuació
- Page 179 and 180:
BANCO CENTRAL DE CHILE(Continuació
- Page 181 and 182:
BANCO CENTRAL DE CHILE(Continuació
- Page 183 and 184:
BANCO CENTRAL DE CHILECÓDIGODESCRI
- Page 185 and 186:
BANCO CENTRAL DE CHILE(Continuació
- Page 187 and 188:
BANCO CENTRAL DE CHILE(Continuació
- Page 189 and 190:
BANCO CENTRAL DE CHILEPRINCIPALES P
- Page 191 and 192:
BANCO CENTRAL DE CHILE(Continuació
- Page 193 and 194:
BANCO CENTRAL DE CHILE(Continuació
- Page 195 and 196:
BANCO CENTRAL DE CHILE(Continuació
- Page 197 and 198:
BANCO CENTRAL DE CHILE(Continuació
- Page 199 and 200:
BANCO CENTRAL DE CHILE(Continuació
- Page 201 and 202:
BANCO CENTRAL DE CHILE(Continuació
- Page 203 and 204:
BANCO CENTRAL DE CHILE(Continuació
- Page 205 and 206:
BANCO CENTRAL DE CHILE(Continuació
- Page 207 and 208:
Asia
- Page 209 and 210:
BANCO CENTRAL DE CHILE(Continuació
- Page 211 and 212:
BANCO CENTRAL DE CHILE(Continuació
- Page 213 and 214:
BANCO CENTRAL DE CHILE(Continuació
- Page 215 and 216:
BANCO CENTRAL DE CHILE(Continuació
- Page 217 and 218:
BANCO CENTRAL DE CHILE(Continuació
- Page 219 and 220:
BANCO CENTRAL DE CHILE(Continuació
- Page 221 and 222:
BANCO CENTRAL DE CHILEPRINCIPALES P
- Page 223 and 224:
BANCO CENTRAL DE CHILE(Continuació
- Page 225 and 226:
BANCO CENTRAL DE CHILE(Continuació
- Page 227 and 228:
BANCO CENTRAL DE CHILE(Continuació
- Page 229 and 230:
BANCO CENTRAL DE CHILE(Continuació
- Page 231 and 232:
BANCO CENTRAL DE CHILE(Continuació
- Page 233 and 234:
BANCO CENTRAL DE CHILE(Continuació
- Page 235 and 236:
África
- Page 237 and 238:
BANCO CENTRAL DE CHILE(Continuació
- Page 239 and 240:
BANCO CENTRAL DE CHILE(Continuació
- Page 241 and 242:
Indicadores de Comercio Exterior
- Page 243 and 244:
Indicadores de Comercio Exterior
- Page 245 and 246:
Indicadores de Comercio Exterior
- Page 247 and 248:
Indicadores deComercio ExteriorÍND
- Page 249 and 250:
BANCO CENTRAL DE CHILEMateria Búsq
- Page 251 and 252:
BANCO CENTRAL DE CHILEMateria Búsq
- Page 253 and 254:
Materia Búsquese en PáginaI Trim.
- Page 255:
Publicación editada por el Departa