- Page 2 and 3: Situación educativa de América La
- Page 4 and 5: Indice Presentación 5 Resumen Ejec
- Page 6 and 7: Presentación Esta publicación cor
- Page 8 and 9: El grupo profesional del Sistema Re
- Page 10 and 11: Se encontraron dificultades para di
- Page 12 and 13: otro lado, debe analizarse de maner
- Page 14 and 15: - Recursos invertidos en educación
- Page 16 and 17: ables es lo que comúnmente se cons
- Page 18 and 19: 18 Cuadro 3. PROYECCIONES DE LA POB
- Page 20 and 21: profundas reformas estructurales. P
- Page 22 and 23: En síntesis, fue evidente la profu
- Page 24 and 25: países muestran, en general, que n
- Page 26 and 27: En general, la evaluación del Proy
- Page 28 and 29: Si se analiza la situación según
- Page 30 and 31: Iglesia. Este apoyo se concentra ma
- Page 32 and 33: La comparación del nivel de escola
- Page 34 and 35: 34 Cuadro 13. ESCOLARIZACION (MILLO
- Page 36 and 37: La educación media En América Lat
- Page 38 and 39: con la situación en 1980 señala q
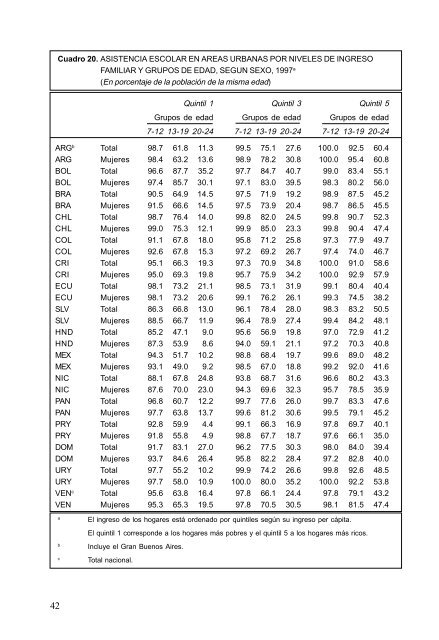
- Page 40 and 41: VI. EQUIDAD EN LAS OPORTUNIDADES ED
- Page 44 and 45: La declaración de Jomtien en su Ar
- Page 46 and 47: 46 Cuadro 21. RESULTADOS DE RENDIMI
- Page 48 and 49: 48 estratos per se. Esto significa
- Page 50 and 51: observen -además de los aspectos r
- Page 52 and 53: Con las estimaciones disponibles, d
- Page 54 and 55: torno a los años 1980 y 1990. Sól
- Page 56 and 57: - El Salvador cuenta con Educación
- Page 58 and 59: lisis innovador de la información
- Page 60 and 61: La globalización se nutre de la re
- Page 62 and 63: X. CONCLUSIONES Y TEMAS EMERGENTES
- Page 64 and 65: Segunda parte Síntesis por países
- Page 66 and 67: El Convenio Andrés Bello -CAB- sur
- Page 68 and 69: Contexto socioeconómico Aunque el
- Page 70 and 71: extensión de la obligatoriedad esc
- Page 72 and 73: En cuanto al tamaño de los estable
- Page 74 and 75: III. ALCANCE DE LA EDUCACION: ACCES
- Page 76 and 77: 1980 y 1991: La tasa neta de escola
- Page 78 and 79: Además, las provincias ofrecen edu
- Page 80 and 81: 82 Cuadro 16. ASISTENCIA ESCOLAR EN
- Page 82 and 83: mientras los niños de Tercer y Cua
- Page 84 and 85: 86 Cuadro 19. NUMERO DE ANALFABETOS
- Page 86 and 87: I. ANALISIS DE LA EVOLUCION DEL CON
- Page 88 and 89: cia social, en la pertinencia cultu
- Page 90 and 91: Actualmente (1999-2000) el PRE cont
- Page 92 and 93:
C. LA EDUCACION MEDIA Como en la ma
- Page 94 and 95:
D. COEFICIENTE DE EFICIENCIA El coe
- Page 96 and 97:
98 A. EDUCACION ESPECIAL Cuadro 12.
- Page 98 and 99:
primaria de la modalidad de educaci
- Page 100 and 101:
102 Cuadro 14. NIVEL DE INSTRUCCION
- Page 102 and 103:
I. ANALISIS DE LA EVOLUCION DEL CON
- Page 104 and 105:
B. PRINCIPALES CAMBIOS EN EL SISTEM
- Page 106 and 107:
aumentó a un 82.5% en 1998 (88.1%
- Page 108 and 109:
Con respeto a materiales didáctico
- Page 110 and 111:
B. DESARROLLO DE LA ENSEÑANZA BASI
- Page 112 and 113:
epetición total bajó más de 10 p
- Page 114 and 115:
El programa “Bolsa-Escola” es u
- Page 116 and 117:
programa es instalar, hasta el 2001
- Page 118 and 119:
Asimismo, la desigualdad en el per
- Page 120 and 121:
siendo el problema más una cuesti
- Page 122 and 123:
124 Cuadro 1. CONTEXTO DEMOGRAFICO:
- Page 124 and 125:
A partir de las políticas aplicada
- Page 126 and 127:
crear una red de liceos de primer n
- Page 128 and 129:
Considerando la importancia de los
- Page 130 and 131:
III. ALCANCE DE LA EDUCACION: ACCES
- Page 132 and 133:
134 Cuadro 11. EDUCACION BASICA. NU
- Page 134 and 135:
El Cuadro 14 muestra la disminució
- Page 136 and 137:
138 Cuadro 17. TASAS DE REPETICION
- Page 138 and 139:
D. EDUCACION ESPECIAL La educación
- Page 140 and 141:
la capacidad para reconocer número
- Page 142 and 143:
asociado con el aumento de la escol
- Page 144 and 145:
I. ANALISIS DE LA EVOLUCION DEL CON
- Page 146 and 147:
elaboró una nueva Constitución Na
- Page 148 and 149:
150 Cuadro 4. ALUMNOS POR DOCENTE P
- Page 150 and 151:
Las cifras anteriores parecen refle
- Page 152 and 153:
esa misma edad, se duplicó entre 1
- Page 154 and 155:
Como observación adicional e inter
- Page 156 and 157:
latinoamericanos que participaron e
- Page 158 and 159:
C. CONSTRUCCION DE INFORMACION RELE
- Page 160 and 161:
La proyección al año 2000 muestra
- Page 162 and 163:
- Se aprueba la Ley 7 600, “Ley d
- Page 164 and 165:
mente de las escuelas rurales. Un e
- Page 166 and 167:
I y II ciclo educa a niños y niña
- Page 168 and 169:
siguiente año. Desde ese momento,
- Page 170 and 171:
B. ESTADISTICAS DE EDUCACION SEGUN
- Page 172 and 173:
En el caso de la educación privada
- Page 174 and 175:
176 Cuadro 13. NUMERO DE ANALFABETO
- Page 176 and 177:
última, a pesar de mantener altas
- Page 178 and 179:
Cuadro 1. CONTEXTO DEMOGRAFICO: POB
- Page 180 and 181:
182 Cuadro 2. RECURSOS HUMANOS EN E
- Page 182 and 183:
184 Cuadro 5. FINANCIAMIENTO DE LA
- Page 184 and 185:
C. PROGRAMAS, CAMPAÑAS POR EL 6º
- Page 186 and 187:
En Cuba, desde el principio de la r
- Page 188 and 189:
VIII. AVANCES EN LA GESTION DE EDUC
- Page 190 and 191:
192 Cuadro 1. CONTEXTO DEMOGRAFICO:
- Page 192 and 193:
194 económico en democracia y just
- Page 194 and 195:
mucho mayor al experimentado por la
- Page 196 and 197:
198 Cuadro 7. ESTABLECIMIENTOS DE N
- Page 198 and 199:
7 La alta tasa bruta ( 122.6%) para
- Page 200 and 201:
IV. FUNCIONAMIENTO DE LA EDUCACION
- Page 202 and 203:
204 Cuadro 16. EDUCACION BASICA. RE
- Page 204 and 205:
A. GENERO Actualmente en Ecuador, c
- Page 206 and 207:
Al analizar la información según
- Page 208 and 209:
espondiente a 15 a 34 años de edad
- Page 210 and 211:
Se responsabilizan de realizar la g
- Page 212 and 213:
Porcentaje congruente con el crecim
- Page 214 and 215:
Lo anterior queda de manifiesto al
- Page 216 and 217:
Al igual que la deserción, la repe
- Page 218 and 219:
tivo, cuyos resultados han sido pub
- Page 220 and 221:
- Reconocimiento del Ministerio de
- Page 222 and 223:
y niñas de las comunidades del ár
- Page 224 and 225:
I. ANALISIS DE LA EVOLUCION DEL CON
- Page 226 and 227:
B. PRINCIPALES CAMBIOS EN EL SISTEM
- Page 228 and 229:
Para educación primaria la situaci
- Page 230 and 231:
Se observa además que durante la p
- Page 232 and 233:
C. REPETICION La repetición, al ig
- Page 234 and 235:
Para la educación secundaria no se
- Page 236 and 237:
Este índice observa valores para t
- Page 238 and 239:
población; multiculturalidad y mul
- Page 240 and 241:
menor edad e incremento de los de m
- Page 242 and 243:
El Plan Nacional de Acción de Educ
- Page 244 and 245:
C. RECURSOS FINANCIEROS En cuanto a
- Page 246 and 247:
to en términos anuales tiene un co
- Page 248 and 249:
de población. Aun así, en el info
- Page 250 and 251:
El análisis por tópicos evaluados
- Page 252 and 253:
Por ello y con el objeto de prepara
- Page 254 and 255:
I. ANALISIS DE LA EVOLUCION DEL CON
- Page 256 and 257:
educación 2 , hasta un enfoque cua
- Page 258 and 259:
260 Cuadro 3. RECURSOS HUMANOS EN E
- Page 260 and 261:
secundaria el crecimiento correspon
- Page 262 and 263:
Es importante destacar que a lo lar
- Page 264 and 265:
266 Cuadro 10. PRIMARIA. TASAS DE R
- Page 266 and 267:
D. EDUCACION ESPECIAL En esta mater
- Page 268 and 269:
270 Cuadro 14. NUMERO DE ANALFABETO
- Page 270 and 271:
hasta ahora observadas, que parecie
- Page 272 and 273:
mencionada no se refleja uniformeme
- Page 274 and 275:
En la primera década se orientó a
- Page 276 and 277:
En educación primaria, la situaci
- Page 278 and 279:
se dotó de 500 bibliotecas de aula
- Page 280 and 281:
282 Cuadro 9. EDUCACION PRIMARIA Y
- Page 282 and 283:
D. COEFICIENTE DE EFICIENCIA En la
- Page 284 and 285:
De lo anterior se deriva que durant
- Page 286 and 287:
tura administrativa de las instanci
- Page 288 and 289:
I. ANALISIS DE LA EVOLUCION DEL CON
- Page 290 and 291:
A inicios de la década del 90, per
- Page 292 and 293:
294 Cuadro 3. RECURSOS HUMANOS EN E
- Page 294 and 295:
III. ALCANCE DE LA EDUCACION: ACCES
- Page 296 and 297:
B. DESERCION En la educación prima
- Page 298 and 299:
El sistema educativo panameño ha r
- Page 300 and 301:
En el año 1995, surge Telebásica
- Page 302 and 303:
tar cambios en la práctica adminis
- Page 304 and 305:
I. DESENVUELVE LA EDUCACION Y ACERC
- Page 306 and 307:
308 Cuadro 3. DISTRIBUCION PORCENTU
- Page 308 and 309:
310 discapacidades, la educación p
- Page 310 and 311:
Del total de los cargos docentes de
- Page 312 and 313:
III. ALCANCE DE LA EDUCACION: ACCES
- Page 314 and 315:
población de 0-14 años (76.5%) en
- Page 316 and 317:
B. LA DESERCION ESCOLAR La deserci
- Page 318 and 319:
‘aulas de apoyo’, porcentaje qu
- Page 320 and 321:
Esta situación pone en evidencia l
- Page 322 and 323:
I. ANALISIS DE LA EVOLUCION DEL CON
- Page 324 and 325:
- Con la Ley General de Educación
- Page 326 and 327:
Estos incrementos en la planta doce
- Page 328 and 329:
Cuadro 6. RECURSOS FINANCIEROS EN E
- Page 330 and 331:
332 Cuadro 9. INDICADORES DE EFICIE
- Page 332 and 333:
Ministerio de Educación, a través
- Page 334 and 335:
VI. CALIDAD DE LA EDUCACION: LOGRO
- Page 336 and 337:
VII. IMPACTO SOCIAL DE LA EDUCACION
- Page 338 and 339:
Educación y en sus organismos admi
- Page 340 and 341:
342 República Dominicana I. ANALIS
- Page 342 and 343:
Los años ochenta se caracterizaron
- Page 344 and 345:
346 Cuadro 4. ALUMNOS POR DOCENTE P
- Page 346 and 347:
No obstante el monto limitado que s
- Page 348 and 349:
IV. FUNCIONAMIENTO DE LA EDUCACION
- Page 350 and 351:
educiendo incluso sus valores entre
- Page 352 and 353:
estudiantes de primaria “aprenden
- Page 354 and 355:
IX. CONCLUSIONES Y TEMAS EMERGENTES
- Page 356 and 357:
La situación anterior -según los
- Page 358 and 359:
9. Selección del personal docente
- Page 360 and 361:
de apariencia irregular, con valore
- Page 362 and 363:
Conviene destacar que, sobre todo d
- Page 364 and 365:
D. COEFICIENTE DE EFICIENCIA El coe
- Page 366 and 367:
VIII. AVANCES EN LA GESTION DE LA E
- Page 368 and 369:
I. ANALISIS DE LA EVOLUCION DEL CON
- Page 370 and 371:
años de estudio fue de 10 años y
- Page 372 and 373:
evidencia la necesidad mejorar los
- Page 374 and 375:
376 Cuadro 7. EDUCACION PREESCOLAR.
- Page 376 and 377:
La tasa de deserción demostró una
- Page 378 and 379:
En lo que se refiere a la asistenci
- Page 380 and 381:
varones, la tasa de alfabetismo de
- Page 382 and 383:
tes. Sin embargo, gran número de p
- Page 384 and 385:
386 Síntesis por países El Caribe
- Page 386 and 387:
actividad económica. Lo anterior i
- Page 388 and 389:
II. RECURSOS INVERTIDOS EN EDUCACIO
- Page 390 and 391:
392 Cuadro 5. NIVEL PREPRIMARIO: TA
- Page 392 and 393:
D. COEFICIENTE DE EFICIENCIA No exi
- Page 394 and 395:
396 Antigua & Barbuda I. CONTEXTO E
- Page 396 and 397:
1975/76, en el que registra 524 doc
- Page 398 and 399:
B. DESERCION No existe información
- Page 400 and 401:
402 Antillas Holandesas I. CONTEXTO
- Page 402 and 403:
preescolar se constata un descenso
- Page 404 and 405:
La información proporcionada por e
- Page 406 and 407:
V. EQUIDAD EN LAS OPORTUNIDADES EDU
- Page 408 and 409:
I. CONTEXTO EN EL QUE SE DESARROLLA
- Page 410 and 411:
B. RECURSOS MATERIALES No existe in
- Page 412 and 413:
La educación secundaria general, s
- Page 414 and 415:
416 Cuadro 5. EDUCACION DE ADULTOS:
- Page 416 and 417:
El país y el sistema educativo han
- Page 418 and 419:
Su economía depende fundamentalmen
- Page 420 and 421:
B. RECURSOS MATERIALES La cantidad
- Page 422 and 423:
tasas brutas mantienen valores cerc
- Page 424 and 425:
D. COEFICIENTE DE EFICIENCIA Para 1
- Page 426 and 427:
I. CONTEXTO EN EL QUE SE DESARROLLA
- Page 428 and 429:
430 Cuadro 3. PERSONAL DOCENTE POR
- Page 430 and 431:
432 Cuadro 6. NIVEL PREPRIMARIO: TA
- Page 432 and 433:
B. DESERCION No existe información
- Page 434 and 435:
I. CONTEXTO EN EL QUE SE DESARROLLA
- Page 436 and 437:
En el nivel primario también se ob
- Page 438 and 439:
440 Cuadro 9. GASTO PUBLICO EN EDUC
- Page 440 and 441:
Cuadro 12. NIVEL PRIMARIO: TASAS BR
- Page 442 and 443:
444 Cuadro 15. NIVEL PRIMARIO: TASA
- Page 444 and 445:
C. CONSTRUCCION DE INFORMACION RELE
- Page 446 and 447:
En el nivel primario hubo un aument
- Page 448 and 449:
III. ALCANCE DE LA EDUCACION: ACCES
- Page 450 and 451:
A. INDICADORES DE INGRESO SEGUN NIV
- Page 452 and 453:
I. CONTEXTO EN EL QUE SE DESARROLLA
- Page 454 and 455:
II. RECURSOS INVERTIDOS EN EDUCACIO
- Page 456 and 457:
458 Cuadro 8. TASAS NETAS Y BRUTAS
- Page 458 and 459:
460 Cuadro 12. PORCENTAJE DE REPITE
- Page 460 and 461:
IX. CONCLUSIONES Y TEMAS EMERGENTES
- Page 462 and 463:
la ultima década un constante crec
- Page 464 and 465:
mente originado en la situación de
- Page 466 and 467:
468 Cuadro 8. NIVEL SECUNDARIO: ALU
- Page 468 and 469:
D. EDUCACION ESPECIAL No existe inf
- Page 470 and 471:
472 Guadalupe I. CONTEXTO EN EL QUE
- Page 472 and 473:
474 Cuadro 3. GASTO PUBLICO EN EDUC
- Page 474 and 475:
C. LA EDUCACION SECUNDARIA La matr
- Page 476 and 477:
478 Cuadro 7. NIVEL DE INSTRUCCION
- Page 478 and 479:
I. CONTEXTO EN EL QUE SE DESARROLLA
- Page 480 and 481:
482 Cuadro 3. GUYANA: PORCENTAJE DE
- Page 482 and 483:
C. RECURSOS FINANCIEROS El gasto p
- Page 484 and 485:
486 Cuadro 9. MATRICULA NIVEL PRIMA
- Page 486 and 487:
488 Cuadro 13. NIVEL SECUNDARIO: TA
- Page 488 and 489:
490 Cuadro 16. TASAS DE REPETICION
- Page 490 and 491:
B. DESCENTRALIZACION Y AUTONOMIA No
- Page 492 and 493:
Es preciso tener presente que Hait
- Page 494 and 495:
y segundo ciclo- y por último, el
- Page 496 and 497:
C. RECURSOS FINANCIEROS La proporci
- Page 498 and 499:
500 Cuadro 7. NIVEL PREPRIMARIO: TA
- Page 500 and 501:
4 Fuente: Internet. Library of Cong
- Page 502 and 503:
B. DESERCION Si bien la deserción
- Page 504 and 505:
D. EDUCACION ESPECIAL No existe inf
- Page 506 and 507:
508 Islas Caimán I. CONTEXTO EN EL
- Page 508 and 509:
A partir de la reforma promovida ha
- Page 510 and 511:
VI. CALIDAD DE LA EDUCACION: LOGRO
- Page 512 and 513:
514 Islas Vírgenes Británicas I.
- Page 514 and 515:
516 Cuadro 2. RELACION ALUMNO-PROFE
- Page 516 and 517:
518 Cuadro 6. NIVEL PRIMARIO: ALUMN
- Page 518 and 519:
A. INDICADORES DE INGRESO SEGUN NIV
- Page 520 and 521:
I. CONTEXTO EN EL QUE SE DESARROLLA
- Page 522 and 523:
524 Cuadro 3. PERSONAL DOCENTE POR
- Page 524 and 525:
La proporción del Producto Naciona
- Page 526 and 527:
528 Cuadro 10. TASA APARENTE DE ING
- Page 528 and 529:
530 Cuadro 13. NIVEL PRIMARIO: AÑO
- Page 530 and 531:
B. DESERCION Los valores indicados
- Page 532 and 533:
VII. IMPACTO SOCIAL DE LA EDUCACION
- Page 534 and 535:
I. CONTEXTO EN EL QUE SE DESARROLLA
- Page 536 and 537:
538 Cuadro 1. PERSONAL DOCENTE POR
- Page 538 and 539:
540 Cuadro 4. NIVEL PREPRIMARIO: TA
- Page 540 and 541:
542 Cuadro 6. NIVEL SECUNDARIO: TAS
- Page 542 and 543:
población de más de 15 años de e
- Page 544 and 545:
I. CONTEXTO EN EL QUE SE DESARROLLA
- Page 546 and 547:
B. RECURSOS MATERIALES La dotación
- Page 548 and 549:
IV. FUNCIONAMIENTO DEL SISTEMA DE E
- Page 550 and 551:
B. DESCENTRALIZACION Y AUTONOMIA No
- Page 552 and 553:
554 Cuadro 2. EVOLUCION DEL PRODUCT
- Page 554 and 555:
556 Cuadro 4. GASTO PUBLICO EN EDUC
- Page 556 and 557:
C. REPETICION No existe informació
- Page 558 and 559:
560 Santa Lucía I. CONTEXTO EN EL
- Page 560 and 561:
562 Cuadro 2. DOCENTES POR NIVEL DE
- Page 562 and 563:
En cuanto a la razón alumno-profes
- Page 564 and 565:
Las funciones principales de la edu
- Page 566 and 567:
568 San Vicente y las Granadinas I.
- Page 568 and 569:
Cuadro 3. PERSONAL DOCENTE POR NIVE
- Page 570 and 571:
572 Cuadro 6. RELACION DE ALUMNOS P
- Page 572 and 573:
D. EDUCACION ESPECIAL No existe inf
- Page 574 and 575:
I. CONTEXTO EN EL QUE SE DESARROLLA
- Page 576 and 577:
B. RECURSOS MATERIALES En cuanto a
- Page 578 and 579:
nivel. Las tasas netas también son
- Page 580 and 581:
582 Cuadro 10. TASAS DE SOBREVIVENC
- Page 582 and 583:
V. EQUIDAD EN LAS OPORTUNIDADES EDU
- Page 584 and 585:
586 Trinidad y Tobago I. CONTEXTO E
- Page 586 and 587:
588 Cuadro 3. PERSONAL DOCENTE POR
- Page 588 and 589:
590 Cuadro 6. NIVEL PREPRIMARIO: MA
- Page 590 and 591:
En educación secundaria, el 99% de
- Page 592 and 593:
B. ESTADISTICAS DE EDUCACION SEGUN
- Page 594 and 595:
IX. CONCLUSIONES Y TEMAS EMERGENTES
- Page 596 and 597:
es para 1980, 1984 y 1993, y muestr
- Page 598 and 599:
B. DESERCION No existe información
- Page 600 and 601:
IX. CONCLUSIONES Y TEMAS EMERGENTES
- Page 602 and 603:
Cuadro 1. POBLACION TOTAL A/ (Miles
- Page 604 and 605:
Cuadro 3. ESTRUCTURA DE LA POBLACIO
- Page 606 and 607:
Cuadro 5. EVOLUCION DEL PRODUCTO IN
- Page 608 and 609:
f f f f México 1989 39 34 49 14 9
- Page 610 and 611:
Cuadro 9. PERSONAL DOCENTE POR NIVE
- Page 612 and 613:
Cuadro 12. GASTO PUBLICO CORRIENTE
- Page 614 and 615:
Cuadro 14. INSTITUCIONES EDUCATIVAS
- Page 616 and 617:
CUADRO 16. ALUMNOS POR NIVEL EDUCAT
- Page 618 and 619:
Cuadro 19.PREESCOLAR: ALUMNOS MATRI
- Page 620 and 621:
Cuadro 21. TASA BRUTA DE MATRÍCULA
- Page 622 and 623:
Cuadro 23.ASISTENCIA ESCOLAR EN ARE
- Page 624 and 625:
Cuadro 25. SOBREVIVENCIA AL QUINTO
- Page 626 and 627:
Cuadro 27. AÑOS DE ESCOLARIDAD POR
- Page 628 and 629:
Cuadro 29. ALFABETISMO POR GENERO (
- Page 630:
Cuadro 30. DISTRIBUCION RELATIVA DE