Hémovigilance Rapport annuel 2021
Analyse des annonces d’hémovigilance 2021
Analyse des annonces d’hémovigilance 2021

You also want an ePaper? Increase the reach of your titles
YUMPU automatically turns print PDFs into web optimized ePapers that Google loves.
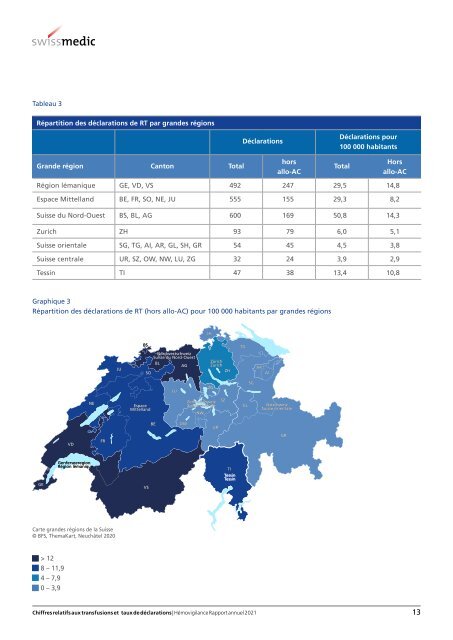
Tableau 3<br />
Répartition des déclarations de RT par grandes régions<br />
Déclarations<br />
Déclarations pour<br />
100 000 habitants<br />
Grande région Canton Total<br />
hors<br />
allo-AC<br />
Total<br />
Hors<br />
allo-AC<br />
Région lémanique GE, VD, VS 492 247 29,5 14,8<br />
Espace Mittelland BE, FR, SO, NE, JU 555 155 29,3 8,2<br />
Suisse du Nord-Ouest BS, BL, AG 600 169 50,8 14,3<br />
Zurich ZH 93 79 6,0 5,1<br />
Suisse orientale SG, TG, AI, AR, GL, SH, GR 54 45 4,5 3,8<br />
Suisse centrale UR, SZ, OW, NW, LU, ZG 32 24 3,9 2,9<br />
Tessin TI 47 38 13,4 10,8<br />
Graphique 3<br />
Répartition des déclarations de RT (hors allo-AC) pour 100 000 habitants par grandes régions<br />
SH<br />
JU<br />
BS<br />
SO<br />
Nordwestschweiz<br />
Suisse du Nord-Ouest<br />
BL<br />
AG<br />
Zürich<br />
Zurich<br />
ZH<br />
TG<br />
AR<br />
AI<br />
LU<br />
ZG<br />
SG<br />
NE<br />
Espace<br />
Mittelland<br />
Zentralschweiz<br />
Suisse centrale<br />
NW<br />
SZ<br />
GL<br />
Ostschweiz<br />
Suisse orientale<br />
BE<br />
OW<br />
UR<br />
VD<br />
FR<br />
GR<br />
GE<br />
Genferseeregion<br />
Région lémanique<br />
VS<br />
TI<br />
Tessin<br />
Tessin<br />
Carte grandes régions de la Suisse<br />
© BFS, ThemaKart, Neuchâtel 2020<br />
> 12<br />
8 – 11,9<br />
4 – 7,9<br />
0 – 3,9<br />
Chiffres relatifs aux transfusions et taux de déclarations | <strong>Hémovigilance</strong> <strong>Rapport</strong> <strong>annuel</strong> <strong>2021</strong><br />
13