- Page 1 and 2: LAPORAN AKHIRPENGEMBANGAN METODE KO
- Page 3 and 4: DAFT AR PELAKSANAJudulPengembangan
- Page 5 and 6: SUMMARY REPORTTerrain correction is
- Page 7 and 8: DAFTAR lSIHalLEMBAR PENGESAHANDAFTA
- Page 9 and 10: DAFTAR TABELTabel1 Interval nilai k
- Page 11 and 12: kuantitatifGambar 8 Penerapan nilai
- Page 13 and 14: 1BASIPENDAHULUAN1.1 Latar BelakangD
- Page 15 and 16: 3BAB IITINJAUAN PUSTAKADalam http:/
- Page 17 and 18: 5BAB IllTUJUAN, SASARAN, DAN MANFAA
- Page 19 and 20: 7Tahap 4: Tahap SosialisasiPembuata
- Page 21 and 22: 9BABVHASIL DAN PEMBAHASANHasil kegi
- Page 23 and 24: optimum selesai dilakukan. Kaj ian
- Page 25 and 26: 3BABVIKESIMPULAN DAN SARAN6.1 Kesim
- Page 27 and 28: .5DAFTAR PUSTAKAAnonim, 2008, Segit
- Page 29 and 30: 1Penurunan Algoritrna Koreksi Terra
- Page 31 and 32: atau kondisi posisi matahari dengan
- Page 33 and 34: Pengujian Algoritma Koreksi Terrain
- Page 35 and 36: ~ ua!S!J90)f !ei!N ue!fn6uad uep ue
- Page 37 and 38: selanjutnya semakin besar nilai sud
- Page 39 and 40: memasukkannya pada persamaan 1, dan
- Page 41 and 42: ' .Nl~tJ311S>f3tJO>f H\11313S N'VO
- Page 43 and 44: 2. 114064_200999Tabel Nilai Koefisi
- Page 45 and 46: 4. 11006rn_080999Tabel Nilai Koefis
- Page 47: DNI1diNVS DNINI'AI.l NV1181NVDN3d V
- Page 51 and 52: Hasil penerapan nilai c untuk setia
- Page 53 and 54: Gam bar 6. Penerapan nilai c di Gun
- Page 55 and 56: 1.... .,/!8·2c: 4·ai c pada Band
- Page 57 and 58: ·c: 0.4 : 0.6B-41 : o.9I;I.Jlc; 1.
- Page 59 and 60: ·- : ~c: ;."7 /0.5 . : • ../. .~
- Page 61 and 62: keduanya. Oleh karena itu dapat dis
- Page 63 and 64: .... ~ 4 • ••= -. 81... -..·
- Page 65 and 66: DN11diNVS DNINI~~ NV1181NVDN3d NVDN
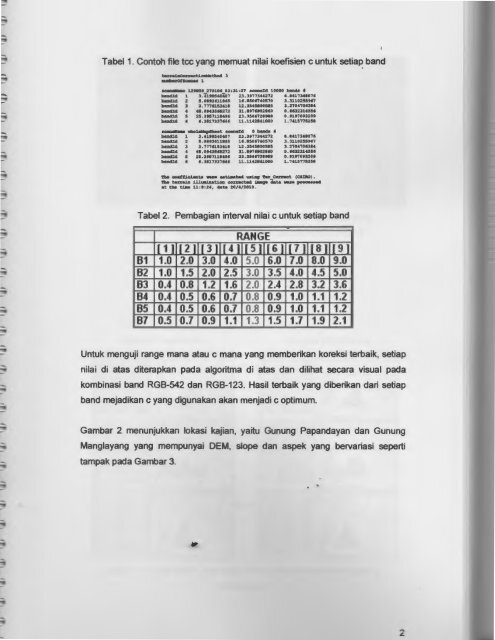
- Page 67 and 68: Berdasarkan Tabel 2, maka nilai set
- Page 69 and 70: C optimum adalah yang memberikan ni
- Page 71 and 72: MODULKOREKSI TERRAIN UNTUK DATA LAN
- Page 73 and 74: DAFTAR lSIHalKA TA PENGANTARDAFTAR
- Page 75 and 76: Di mana,RHRTszcRH = RT (Cos (sz) +c
- Page 77 and 78: I radianceMatahari~zz--Keterangan :
- Page 79 and 80: II. TAHAPAN KOREKSI TERRAIN1. PENGU
- Page 81 and 82: .... s..-.~ ~)tt-. s-. ~ 'lgt..et ~
- Page 83 and 84: Kemudian lihat hasil. Bila tidak be
- Page 85 and 86: Input i1 = slopei2= aspectVariabelS
- Page 87 and 88: 7. Selanjutnya save hasil sebagai I
- Page 89 and 90: 4-1. PENGGABUNGAN LAYER (BAND 1-7 D
- Page 91 and 92: ,~•e~r~~- P- ·~~ ~~~ • 1 • 1
- Page 93 and 94: 9. Pilih semua poligon dan beri nam
- Page 95 and 96: Fcrmu11 Editor"r.al!c Components Ra
- Page 97 and 98: 5. Buat Graph untuk kedua nilai den
- Page 99 and 100:
Kemudian K band 2 sampai band 7 dib
- Page 101 and 102:
Metode7-1. PENGUJIAN VISUAL1. Buka
- Page 103 and 104:
4. Kemudian tutup semua.5. Selanjut
- Page 105 and 106:
INniNI.ldO :> N31SI:I30>1 NV>I~VSVC
- Page 107 and 108:
Modul ini merupakan hasil kajian ta
- Page 109 and 110:
34. PENGGABUNGAN LAYER (BAND 1-7, S
- Page 111 and 112:
Variable 2 = SZ (dari Tahapan 2)Var
- Page 113 and 114:
LAPORANBIMBINGAN TEKNISKOREKSI TERR
- Page 115 and 116:
lsi modul sosialisasi ini be~umlahs
- Page 117 and 118:
IV. KESIMPULAN DAN SARAN4.1. Kesimp
- Page 119 and 120:
Lampiran 2.DAFTAR PESERTASOSIALISAS
- Page 121 and 122:
Rabu/ 20Oktober 201 0 09.00- 12.00
- Page 123:
fnstruktur yang memandu pesertadafa
- Page 126 and 127:
ISV'Sil'v'ISOS HV'Iln>i NV'HV'8
- Page 128 and 129:
11/"L."LIL.U 1 UKoreksi MatahariTah
- Page 130 and 131:
11/22/2010Apa dan Mengapa Koreksi T
- Page 132 and 133:
11/22/2010KOREKSI TERRAIN:TEORI DAN
- Page 134 and 135:
11/22/2010MENENTUKAN COS (i)z;T\ 11
- Page 136 and 137:
11/22/2010PERHITUNGAN KOEFISIEN CKo
- Page 138 and 139:
11/22/2010PENGUJIAN SECARA STATISTI
- Page 140 and 141:
RANGKUMAN BCHP(BUKU CATATAN HARlAN
- Page 142 and 143:
.,.' --- ..... -- • •• l- ,l_
- Page 144 and 145:
09.00-16.00 terrainRapat terkait Ri
- Page 146 and 147:
18 I Kamis, 25/03/1 0 I Proses kore
- Page 148 and 149:
5 I Kamis, 08/04/1 0 I Proses korek
- Page 150 and 151:
~IGI~fil~~~~~ .....Nom or BCHP : ..
- Page 152 and 153:
Rekab BCHP bulan Feb-mei 2010Nom or
- Page 154 and 155:
.......22 I Rabu, 30/06/1009.00-16.
- Page 156 and 157:
181920Senin, 26/07/1009.00-16.00Sel
- Page 158 and 159:
11 I Jum'at, 13/08/1009.00-16.00Pro
- Page 160 and 161:
. . .. ...~- "'14 Sen in, 20/09/10(
- Page 162 and 163:
13 I Rabu, 20/1 0/1 009.00-16.00Sos
- Page 164:
13 I Kamis, 18/11/10 - Mencetak lap


