Piano Stralcio di Bacino per l'Assetto Idrogeologico (P.A.I.)
Piano Stralcio di Bacino per l'Assetto Idrogeologico (P.A.I.)
Piano Stralcio di Bacino per l'Assetto Idrogeologico (P.A.I.)

You also want an ePaper? Increase the reach of your titles
YUMPU automatically turns print PDFs into web optimized ePapers that Google loves.
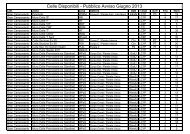
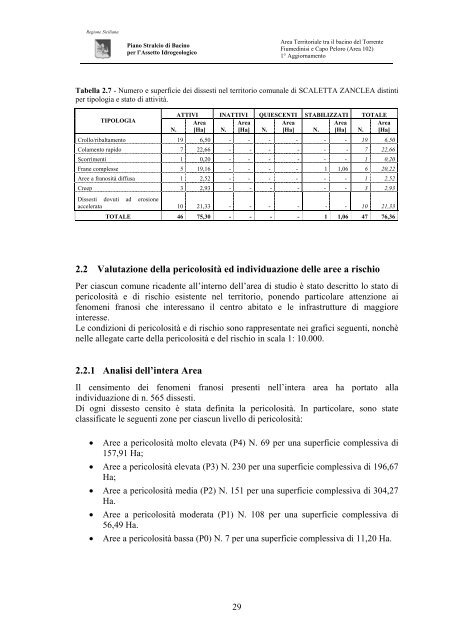
Regione Siciliana<strong>Piano</strong> <strong>Stralcio</strong> <strong>di</strong> <strong>Bacino</strong><strong>per</strong> l’Assetto <strong>Idrogeologico</strong>Area Territoriale tra il bacino del TorrenteFiume<strong>di</strong>nisi e Capo Peloro (Area 102)1° AggiornamentoTabella 2.7 - Numero e su<strong>per</strong>ficie dei <strong>di</strong>ssesti nel territorio comunale <strong>di</strong> SCALETTA ZANCLEA <strong>di</strong>stinti<strong>per</strong> tipologia e stato <strong>di</strong> attività.ATTIVI INATTIVI QUIESCENTI STABILIZZATI TOTALETIPOLOGIAAreaAreaAreaAreaAreaN. [Ha] N. [Ha] N. [Ha] N. [Ha] N. [Ha]Crollo/ribaltamento 19 6,50 - - - - - - 19 6,50Colamento rapido 7 22,66 - - - - - - 7 22,66Scorrimenti 1 0,20 - - - - - - 1 0,20Frane complesse 5 19,16 - - - - 1 1,06 6 20,22Aree a franosità <strong>di</strong>ffusa 1 2,52 - - - - - - 1 2,52Creep 3 2,93 - - - - - - 3 2,93Dissesti dovuti ad erosioneaccelerata 10 21,33 - - - - - - 10 21,33TOTALE 46 75,30 - - - - 1 1,06 47 76,362.2 Valutazione della <strong>per</strong>icolosità ed in<strong>di</strong>viduazione delle aree a rischioPer ciascun comune ricadente all’interno dell’area <strong>di</strong> stu<strong>di</strong>o è stato descritto lo stato <strong>di</strong><strong>per</strong>icolosità e <strong>di</strong> rischio esistente nel territorio, ponendo particolare attenzione aifenomeni franosi che interessano il centro abitato e le infrastrutture <strong>di</strong> maggioreinteresse.Le con<strong>di</strong>zioni <strong>di</strong> <strong>per</strong>icolosità e <strong>di</strong> rischio sono rappresentate nei grafici seguenti, nonchènelle allegate carte della <strong>per</strong>icolosità e del rischio in scala 1: 10.000.2.2.1 Analisi dell’intera AreaIl censimento dei fenomeni franosi presenti nell’intera area ha portato allain<strong>di</strong>viduazione <strong>di</strong> n. 565 <strong>di</strong>ssesti.Di ogni <strong>di</strong>ssesto censito è stata definita la <strong>per</strong>icolosità. In particolare, sono stateclassificate le seguenti zone <strong>per</strong> ciascun livello <strong>di</strong> <strong>per</strong>icolosità:• Aree a <strong>per</strong>icolosità molto elevata (P4) N. 69 <strong>per</strong> una su<strong>per</strong>ficie complessiva <strong>di</strong>157,91 Ha;• Aree a <strong>per</strong>icolosità elevata (P3) N. 230 <strong>per</strong> una su<strong>per</strong>ficie complessiva <strong>di</strong> 196,67Ha;• Aree a <strong>per</strong>icolosità me<strong>di</strong>a (P2) N. 151 <strong>per</strong> una su<strong>per</strong>ficie complessiva <strong>di</strong> 304,27Ha.• Aree a <strong>per</strong>icolosità moderata (P1) N. 108 <strong>per</strong> una su<strong>per</strong>ficie complessiva <strong>di</strong>56,49 Ha.• Aree a <strong>per</strong>icolosità bassa (P0) N. 7 <strong>per</strong> una su<strong>per</strong>ficie complessiva <strong>di</strong> 11,20 Ha.29