Fylkestingsvalget 1995 (NOS C 343) - Statistisk sentralbyrå
Fylkestingsvalget 1995 (NOS C 343) - Statistisk sentralbyrå
Fylkestingsvalget 1995 (NOS C 343) - Statistisk sentralbyrå
Create successful ePaper yourself
Turn your PDF publications into a flip-book with our unique Google optimized e-Paper software.
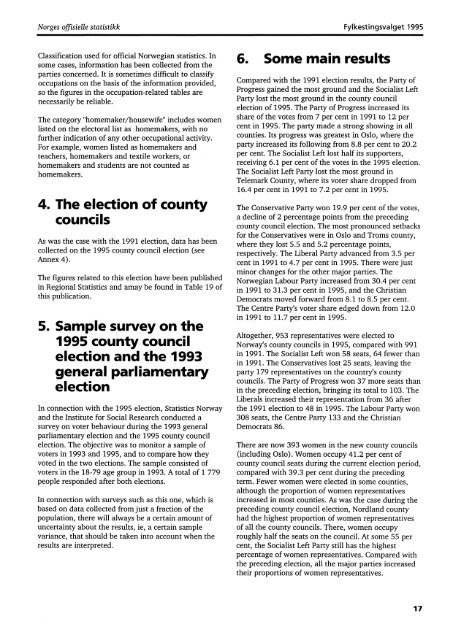
Norges offisielle statistikk <strong>Fylkestingsvalget</strong> <strong>1995</strong><br />
Classification used for official Norwegian statistics. In<br />
some cases, information has been collected from the<br />
parties concerned. It is sometimes difficult to classify<br />
occupations on the basis of the information provided,<br />
so the figures in the occupation-related tables are<br />
necessarily be reliable.<br />
The category "homemaker/housewife" includes women<br />
listed on the electoral list as homemakers, with no<br />
further indication of any other occupational activity.<br />
For example, women listed as homemakers and<br />
teachers, homemakers and textile workers, or<br />
homemakers and students are not counted as<br />
homemakers.<br />
4. The election of county<br />
councils<br />
As was the case with the 1991 election, data has been<br />
collected on the <strong>1995</strong> county council election (see<br />
Annex 4).<br />
The figures related to this election have been published<br />
in Regional Statistics and amay be found in Table 19 of<br />
this publication.<br />
5. Sample survey on the<br />
<strong>1995</strong> county council<br />
election and the 1993<br />
general parliamentary<br />
election<br />
In connection with the <strong>1995</strong> election, Statistics Norway<br />
and the Institute for Social Research conducted a<br />
survey on voter behaviour during the 1993 general<br />
parliamentary election and the <strong>1995</strong> county council<br />
election. The objective was to monitor a sample of<br />
voters in 1993 and <strong>1995</strong>, and to compare how they<br />
voted in the two elections. The sample consisted of<br />
voters in the 18-79 age group in 1993. A total of 1 779<br />
people responded after both elections.<br />
In connection with surveys such as this one, which is<br />
based on data collected from just a fraction of the<br />
population, there will always be a certain amount of<br />
uncertainty about the results, ie, a certain sample<br />
variance, that should be taken into account when the<br />
results are interpreted.<br />
6. Some main results<br />
Compared with the 1991 election results, the Party of<br />
Progress gained the most ground and the Socialist Left<br />
Party lost the most ground in the county council<br />
election of <strong>1995</strong>. The Party of Progress increased its<br />
share of the votes from 7 per cent in 1991 to 12 per<br />
cent in <strong>1995</strong>. The party made a strong showing in all<br />
counties. Its progress was greatest in Oslo, where the<br />
party increased its following from 8.8 per cent to 20.2<br />
per cent. The Socialist Left lost half its supporters,<br />
receiving 6.1 per cent of the votes in the <strong>1995</strong> election.<br />
The Socialist Left Party lost the most ground in<br />
Telemark County, where its voter share dropped from<br />
16.4 per cent in 1991 to 7.2 per cent in <strong>1995</strong>.<br />
The Conservative Party won 19.9 per cent of the votes,<br />
a decline of 2 percentage points from the preceding<br />
county council election. The most pronounced setbacks<br />
for the Conservatives were in Oslo and Troms county,<br />
where they lost 5.5 and 5.2 percentage points,<br />
respectively. The Liberal Party advanced from 3.5 per<br />
cent in 1991 to 4.7 per cent in <strong>1995</strong>. There were just<br />
minor changes for the other major parties. The<br />
Norwegian Labour Party increased from 30.4 per cent<br />
in 1991 to 31.3 per cent in <strong>1995</strong>, and the Christian<br />
Democrats moved forward from 8.1 to 8.5 per cent.<br />
The Centre Party's voter share edged down from 12.0<br />
in 1991 to 11.7 per cent in <strong>1995</strong>.<br />
Altogether, 953 representatives were elected to<br />
Norway's county councils in <strong>1995</strong>, compared with 991<br />
in 1991. The Socialist Left won 58 seats, 64 fewer than<br />
in 1991. The Conservatives lost 25 seats, leaving the<br />
party 179 representatives on the country's county<br />
councils. The Party of Progress won 37 more seats than<br />
in the preceding election, bringing its total to 103. The<br />
Liberals increased their representation from 36 after<br />
the 1991 election to 48 in <strong>1995</strong>. The Labour Party won<br />
308 seats, the Centre Party 133 and the Christian<br />
Democrats 86.<br />
There are now 393 women in the new county councils<br />
(including Oslo). Women occupy 41.2 per cent of<br />
county council seats during the current election period,<br />
compared with 39.3 per cent during the preceding<br />
term. Fewer women were elected in some counties,<br />
although the proportion of women representatives<br />
increased in most counties. As was the case during the<br />
preceding county council election, Nordland county<br />
had the highest proportion of women representatives<br />
of all the county councils. There, women occupy<br />
roughly half the seats on the council. At some 55 per<br />
cent, the Socialist Left Party still has the highest<br />
percentage of women representatives. Compared with<br />
the preceding election, all the major parties increased<br />
their proportions of women representatives.<br />
17


