Relatório Final PIBIC - Pesquisa Mercado de Trabalho em - Pólo ...
Relatório Final PIBIC - Pesquisa Mercado de Trabalho em - Pólo ...
Relatório Final PIBIC - Pesquisa Mercado de Trabalho em - Pólo ...

You also want an ePaper? Increase the reach of your titles
YUMPU automatically turns print PDFs into web optimized ePapers that Google loves.
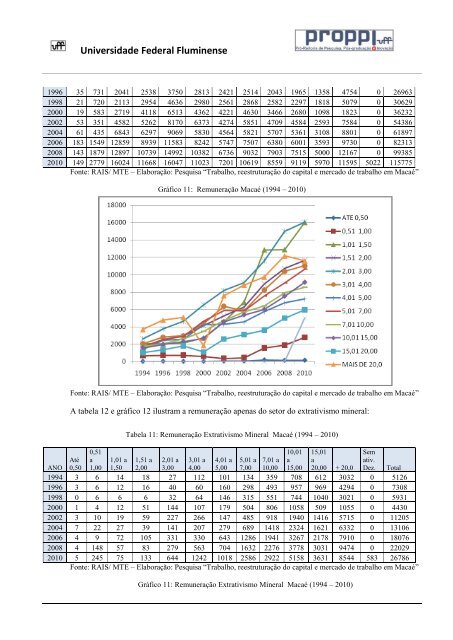
Universida<strong>de</strong> Fe<strong>de</strong>ral Fluminense<br />
1996 35 731 2041 2538 3750 2813 2421 2514 2043 1965 1358 4754 0 26963<br />
1998 21 720 2113 2954 4636 2980 2561 2868 2582 2297 1818 5079 0 30629<br />
2000 19 583 2719 4118 6513 4362 4221 4630 3466 2680 1098 1823 0 36232<br />
2002 53 351 4582 5262 8170 6373 4274 5851 4709 4584 2593 7584 0 54386<br />
2004 61 435 6843 6297 9069 5830 4564 5821 5707 5361 3108 8801 0 61897<br />
2006 183 1549 12859 8939 11583 8242 5747 7507 6380 6001 3593 9730 0 82313<br />
2008 143 1879 12897 10739 14992 10382 6736 9032 7903 7515 5000 12167 0 99385<br />
2010 149 2779 16024 11668 16047 11023 7201 10619 8559 9119 5970 11595 5022 115775<br />
Fonte: RAIS/ MTE – Elaboração: <strong>Pesquisa</strong> “<strong>Trabalho</strong>, reestruturação do capital e mercado <strong>de</strong> trabalho <strong>em</strong> Macaé”<br />
ANO<br />
Gráfico 11: R<strong>em</strong>uneração Macaé (1994 – 2010)<br />
Fonte: RAIS/ MTE – Elaboração: <strong>Pesquisa</strong> “<strong>Trabalho</strong>, reestruturação do capital e mercado <strong>de</strong> trabalho <strong>em</strong> Macaé”<br />
A tabela 12 e gráfico 12 ilustram a r<strong>em</strong>uneração apenas do setor do extrativismo mineral:<br />
Até<br />
0,50<br />
0,51<br />
a<br />
1,00<br />
1,01 a<br />
1,50<br />
Tabela 11: R<strong>em</strong>uneração Extrativismo Mineral Macaé (1994 – 2010)<br />
1,51 a<br />
2,00<br />
2,01 a<br />
3,00<br />
3,01 a<br />
4,00<br />
4,01 a<br />
5,00<br />
5,01 a<br />
7,00<br />
7,01 a<br />
10,00<br />
10,01<br />
a<br />
15,00<br />
15,01<br />
a<br />
20,00 + 20,0<br />
S<strong>em</strong><br />
ativ.<br />
Dez. Total<br />
1994 3 6 14 18 27 112 101 134 359 708 612 3032 0 5126<br />
1996 3 6 12 16 40 60 160 298 493 957 969 4294 0 7308<br />
1998 0 6 6 6 32 64 146 315 551 744 1040 3021 0 5931<br />
2000 1 4 12 51 144 107 179 504 806 1058 509 1055 0 4430<br />
2002 3 10 19 59 227 266 147 485 918 1940 1416 5715 0 11205<br />
2004 7 22 27 39 141 207 279 689 1418 2324 1621 6332 0 13106<br />
2006 4 9 72 105 331 330 643 1286 1941 3267 2178 7910 0 18076<br />
2008 4 148 57 83 279 563 704 1632 2276 3778 3031 9474 0 22029<br />
2010 5 245 75 133 644 1242 1018 2586 2922 5158 3631 8544 583 26786<br />
Fonte: RAIS/ MTE – Elaboração: <strong>Pesquisa</strong> “<strong>Trabalho</strong>, reestruturação do capital e mercado <strong>de</strong> trabalho <strong>em</strong> Macaé”<br />
Gráfico 11: R<strong>em</strong>uneração Extrativismo Mineral Macaé (1994 – 2010)