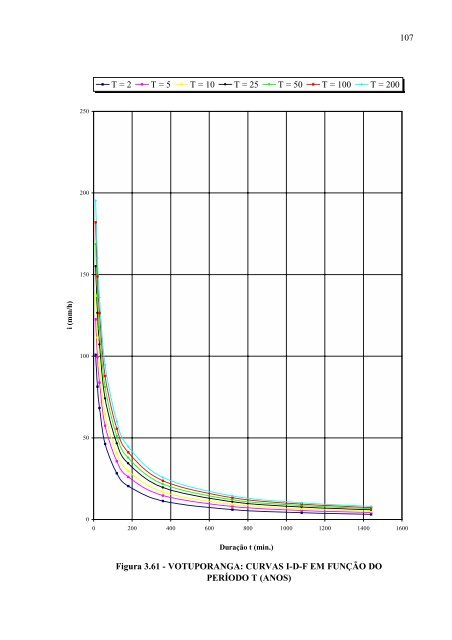
1063.4.30 Relação intensida<strong>de</strong> – duração – perío<strong>do</strong> <strong>de</strong> retorno para VotuporangaNome da estação: Votuporanga – B6-036RCoor<strong>de</strong>nadas geográficas: Lat. 20°26’S; Long. 49°59’WAltitu<strong>de</strong>:510 mPerío<strong>do</strong> <strong>de</strong> da<strong>do</strong>s utiliza<strong>do</strong>s: 1966-68; 1970-75; 1977-86; 1988-97 (29 anos)Equação: i t,T = 59,1192 (t+30) –0,9566 + 7,5593 (t+30) –0,8250 .[–0,4744–0,8863 ln ln(T/T–1)] (3.37)para 10 ≤ t ≤ 1440com: i: intensida<strong>de</strong> da chuva, correspon<strong>de</strong>nte à duração t e perío<strong>do</strong> <strong>de</strong> retorno T, <strong>em</strong> mm/min;t: duração da chuva <strong>em</strong> minutos;T: perío<strong>do</strong> <strong>de</strong> retorno <strong>em</strong> anos.Tabela 3.61 – Votuporanga: Previsão <strong>de</strong> máximas intensida<strong>de</strong>s <strong>de</strong> chuvas, <strong>em</strong> mm/hDuração tPerío<strong>do</strong> <strong>de</strong> retorno T (anos)(minutos) 2 5 10 15 20 25 50 100 20010 100,9 122,6 137,0 145,1 150,8 155,1 168,6 182,0 195,320 81,4 99,5 111,4 118,2 122,9 126,6 137,8 148,9 160,030 68,3 83,9 94,2 100,0 104,0 107,2 116,8 126,4 135,960 46,3 57,4 64,8 68,9 71,8 74,1 81,0 87,8 94,7120 28,3 35,6 40,4 43,2 45,1 46,6 51,1 55,6 60,1180 20,5 26,0 29,7 31,7 33,2 34,3 37,7 41,1 44,5360 11,3 14,6 16,8 18,0 18,9 19,6 21,6 23,7 25,7720 6,0 8,0 9,2 10,0 10,5 10,9 12,1 13,2 14,41080 4,1 5,5 6,5 7,0 7,3 7,6 8,5 9,4 10,21440 3,1 4,3 5,0 5,4 5,7 5,9 6,6 7,3 8,0Tabela 3.62 – Votuporanga: Previsão <strong>de</strong> máximas alturas <strong>de</strong> chuvas, <strong>em</strong> mmDuração tPerío<strong>do</strong> <strong>de</strong> retorno T (anos)(minutos) 2 5 10 15 20 25 50 100 20010 16,8 20,4 22,8 24,2 25,1 25,9 28,1 30,3 32,620 27,1 33,2 37,1 39,4 41,0 42,2 45,9 49,6 53,330 34,2 41,9 47,1 50,0 52,0 53,6 58,4 63,2 68,060 46,3 57,4 64,8 68,9 71,8 74,1 81,0 87,8 94,7120 56,6 71,2 80,9 86,3 90,2 93,1 102,2 111,2 120,1180 61,5 78,1 89,0 95,2 99,6 102,9 113,2 123,4 133,6360 67,8 87,7 100,9 108,3 113,5 117,5 129,9 142,1 154,4720 72,2 95,4 110,8 119,5 125,6 130,2 144,7 159,0 173,21080 74,3 99,5 116,2 125,6 132,2 137,2 152,9 168,4 183,91440 75,5 102,2 119,8 129,8 136,8 142,1 158,7 175,1 191,5
107T = 2 T = 5 T = 10 T = 25 T = 50 T = 100 T = 200250200150i (mm/h)1005000 200 400 600 800 1000 1200 1400 1600Duração t (min.)Figura 3.61 - VOTUPORANGA: CURVAS I-D-F EM FUNÇÃO DOPERÍODO T (ANOS)