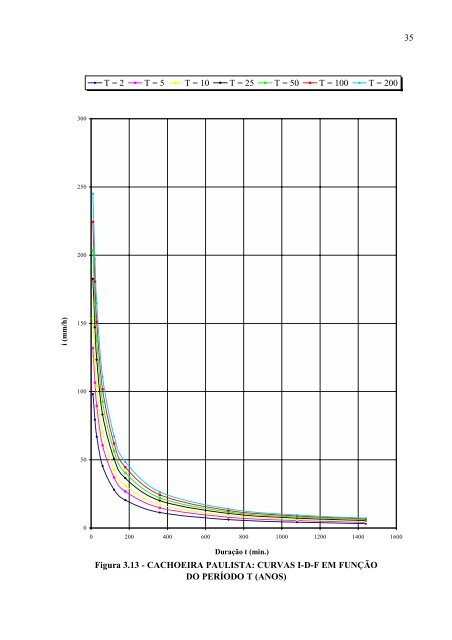
343.4.6 Relação intensida<strong>de</strong> – duração – perío<strong>do</strong> <strong>de</strong> retorno para Cachoeira PaulistaNome da estação: Cachoeira Paulista – D2-013RCoor<strong>de</strong>nadas geográficas: Lat. 22°40’S; Long. 45°01’WAltitu<strong>de</strong>:520 mPerío<strong>do</strong>s <strong>de</strong> da<strong>do</strong>s utiliza<strong>do</strong>s: 1956-68; 1970-85; 1988-94 (36 anos)Equação: i t,T = 57,1456 (t+30) –0,9495 + 22,7285 (t+30) –0,9986 . [–0,4716–0,8716 ln ln(T/T–1)] (3.12)para 10 ≤ t ≤ 1440on<strong>de</strong>: i: intensida<strong>de</strong> da chuva, correspon<strong>de</strong>nte à duração t e perío<strong>do</strong> <strong>de</strong> retorno T, <strong>em</strong> mm/min;t: duração da chuva <strong>em</strong> minutos;T: perío<strong>do</strong> <strong>de</strong> retorno <strong>em</strong> anos.Tabela 3.13 – Cachoeira Paulista: Previsão <strong>de</strong> máximas intensida<strong>de</strong>s <strong>de</strong> chuvas, <strong>em</strong> mm/hDuração tPerío<strong>do</strong> <strong>de</strong> retorno T (anos)(minutos) 2 5 10 15 20 25 50 100 20010 98,1 131,9 154,3 167,0 175,8 182,7 203,7 224,5 245,320 79,4 106,5 124,4 134,5 141,6 147,1 163,9 180,6 197,230 66,8 89,4 104,3 112,8 118,7 123,2 137,2 151,2 165,060 45,5 60,6 70,5 76,2 80,1 83,1 92,5 101,8 111,0120 28,1 37,1 43,1 46,5 48,8 50,7 56,3 61,8 67,4180 20,4 26,9 31,1 33,6 35,2 36,5 40,6 44,5 48,5360 11,3 14,8 17,1 18,4 19,4 20,1 22,2 24,4 26,5720 6,1 7,9 9,1 9,8 10,3 10,6 11,8 12,9 14,01080 4,2 5,4 6,3 6,7 7,0 7,3 8,0 8,8 9,51440 3,2 4,2 4,8 5,1 5,4 5,5 6,1 6,7 7,3Tabela 3.14 – Cachoeira Paulista: Previsão <strong>de</strong> máximas alturas <strong>de</strong> chuvas, <strong>em</strong> mmDuração tPerío<strong>do</strong> <strong>de</strong> retorno T (anos)(minutos) 2 5 10 15 20 25 50 100 20010 16,3 22,0 25,7 27,8 29,3 30,4 33,9 37,4 40,920 26,5 35,5 41,5 44,8 47,2 49,0 54,6 60,2 65,730 33,4 44,7 52,2 56,4 59,3 61,6 68,6 75,6 82,560 45,5 60,6 70,5 76,2 80,1 83,1 92,5 101,8 111,0120 56,1 74,2 86,2 92,9 97,7 101,3 112,5 123,7 134,8180 61,2 80,6 93,4 100,7 105,7 109,6 121,7 133,6 145,5360 68,1 89,0 102,8 110,6 116,1 120,3 133,3 146,2 159,0720 73,3 95,1 109,5 117,6 123,3 127,7 141,2 154,6 167,91080 75,9 97,9 112,5 120,8 126,5 131,0 144,7 158,3 171,81440 77,5 99,7 114,4 122,7 128,6 133,0 146,8 160,5 174,1
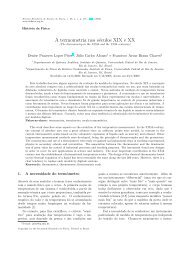
35T = 2 T = 5 T = 10 T = 25 T = 50 T = 100 T = 200300250200i (mm/h)1501005000 200 400 600 800 1000 1200 1400 1600Duração t (min.)Figura 3.13 - CACHOEIRA PAULISTA: CURVAS I-D-F EM FUNÇÃODO PERÍODO T (ANOS)