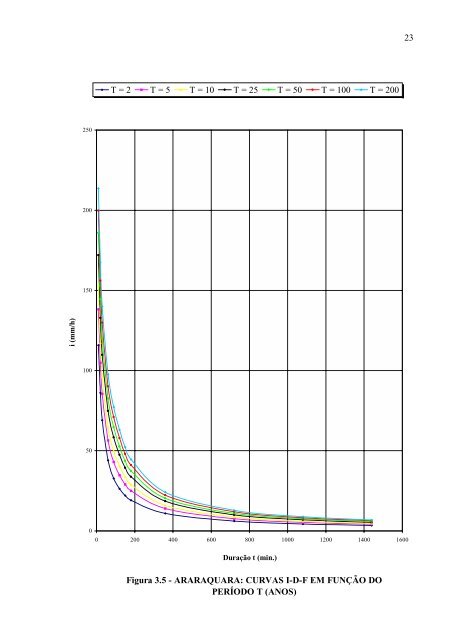
223.4.2 Relação intensida<strong>de</strong> – duração – perío<strong>do</strong> <strong>de</strong> retorno para AraraquaraNome da estação: Chibarro – C5-017RCoor<strong>de</strong>nadas geográficas: Lat. 21°53’S; Long. 48°09’WAltitu<strong>de</strong>:580 mPerío<strong>do</strong>s <strong>de</strong> da<strong>do</strong>s utiliza<strong>do</strong>s: 1970; 1973-91; 1993-95; 1997 (24 anos)Equação para 10 ≤ t ≤ 105:i t,T = 32,4618 (t+15) –0,8684 + 2,1429 (t+15) –0,5482 . [– 0,4772 – 0,9010 ln ln(T/T–1)] (3.7)Equação para 105 < t ≤ 1440:i t,T = 32,4618 (t+15) –0,8684 + 18,4683 (t+15) –0,9984 . [– 0,4772 – 0,9010 ln ln(T/T–1)] (3.8)on<strong>de</strong>: i: intensida<strong>de</strong> da chuva, correspon<strong>de</strong>nte à duração t e perío<strong>do</strong> <strong>de</strong> retorno T, <strong>em</strong> mm/min;t: duração da chuva <strong>em</strong> minutos;T: perío<strong>do</strong> <strong>de</strong> retorno <strong>em</strong> anos.Tabela 3.5 – Araraquara: Previsão <strong>de</strong> máximas intensida<strong>de</strong>s <strong>de</strong> chuvas, <strong>em</strong> mm/hDuração tPerío<strong>do</strong> <strong>de</strong> retorno T (anos)(minutos) 2 5 10 15 20 25 50 100 20010 115,8 138,2 153,1 161,5 167,4 171,9 185,9 199,8 213,620 86,2 104,9 117,2 124,2 129,1 132,9 144,5 156,0 167,530 69,1 85,4 96,2 102,2 106,5 109,8 119,9 129,9 139,960 44,1 56,4 64,5 69,1 72,3 74,8 82,5 90,1 97,6120 26,3 34,7 40,3 43,5 45,7 47,4 52,6 57,9 63,0180 19,1 25,0 28,9 31,1 32,6 33,8 37,4 41,0 44,6360 10,9 13,9 16,0 17,1 17,9 18,5 20,4 22,3 24,1720 6,1 7,6 8,7 9,3 9,7 10,0 10,9 11,9 12,91080 4,3 5,4 6,1 6,4 6,7 6,9 7,6 8,2 8,91440 3,4 4,2 4,7 5,0 5,2 5,3 5,8 6,3 6,8Tabela 3.6 – Araraqura: Previsão <strong>de</strong> máximas alturas <strong>de</strong> chuvas, <strong>em</strong> mmDuração tPerío<strong>do</strong> <strong>de</strong> retorno T (anos)(minutos) 2 5 10 15 20 25 50 100 20010 19,3 23,0 25,5 26,9 27,9 28,7 31,0 33,3 35,620 28,7 35,0 39,1 41,4 43,0 44,3 48,2 52,0 55,830 34,5 42,7 48,1 51,1 53,3 54,9 60,0 65,0 70,060 44,1 56,4 64,5 69,1 72,3 74,8 82,5 90,1 97,6120 52,6 69,5 80,7 87,0 91,4 94,8 105,3 115,7 126,1180 57,4 75,0 86,6 93,2 97,8 101,3 112,2 123,0 133,8360 65,3 83,6 95,7 102,6 107,3 111,0 122,4 133,6 144,8720 73,1 91,8 104,1 111,1 116,0 119,8 131,3 142,8 154,31080 77,7 96,5 109,0 116,0 120,9 124,7 136,4 148,0 159,51440 81,0 99,9 112,4 119,5 124,4 128,2 140,0 151,6 163,2
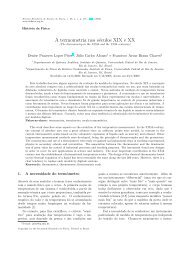
23T = 2 T = 5 T = 10 T = 25 T = 50 T = 100 T = 200250200150i (mm/h)1005000 200 400 600 800 1000 1200 1400 1600Duração t (min.)Figura 3.5 - ARARAQUARA: CURVAS I-D-F EM FUNÇÃO DOPERÍODO T (ANOS)