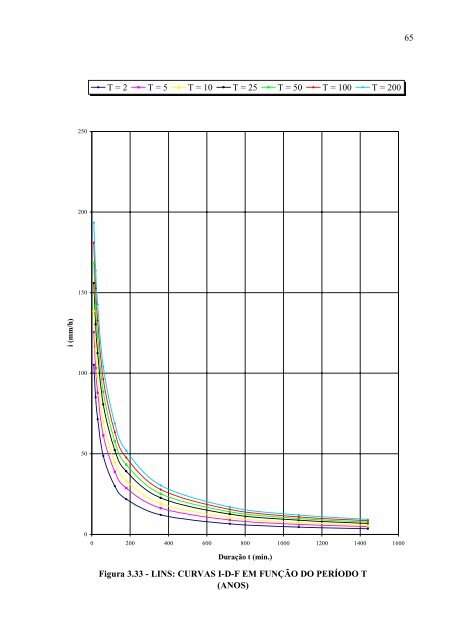
643.4.16 Relação intensida<strong>de</strong> – duração – perío<strong>do</strong> <strong>de</strong> retorno para LinsNome da estação: Fazenda São Pedro – C6-015RCoor<strong>de</strong>nadas geográficas: Lat. 21°42’S; Long. 49°41’WAltitu<strong>de</strong>:480 mPerío<strong>do</strong> <strong>de</strong> da<strong>do</strong>s utiliza<strong>do</strong>s: 1974-89; 1991-97 (23 anos)Equação: i t,T = 57,4647 (t+30) –0,9386 + 16,5999 (t+65) –0,9078 .[–0,4778–0,9046 ln ln(T/T-1)] (3.23)para 10 ≤ t ≤ 1440com: i: intensida<strong>de</strong> da chuva, correspon<strong>de</strong>nte à duração t e perío<strong>do</strong> <strong>de</strong> retorno T, <strong>em</strong> mm/min;t: duração da chuva <strong>em</strong> minutos;T: perío<strong>do</strong> <strong>de</strong> retorno <strong>em</strong> anos.Tabela 3.33 – Lins: Previsão <strong>de</strong> máximas intensida<strong>de</strong>s <strong>de</strong> chuvas, <strong>em</strong> mm/hDuração tPerío<strong>do</strong> <strong>de</strong> retorno T (anos)(minutos) 2 5 10 15 20 25 50 100 20010 105,2 125,5 138,9 146,5 151,8 155,9 168,4 180,9 193,420 85,1 103,2 115,2 121,9 126,7 130,3 141,5 152,7 163,830 71,6 87,9 98,7 104,9 109,1 112,4 122,6 132,6 142,760 48,7 61,4 69,9 74,6 78,0 80,5 88,4 96,3 104,1120 30,0 38,9 44,8 48,2 50,5 52,3 57,9 63,4 68,8180 21,8 28,7 33,3 35,9 37,7 39,1 43,4 47,7 51,9360 12,2 16,4 19,1 20,7 21,8 22,6 25,2 27,8 30,4720 6,6 9,0 10,6 11,5 12,1 12,6 14,1 15,5 17,01080 4,5 6,2 7,4 8,0 8,5 8,8 9,9 10,9 12,01440 3,5 4,8 5,7 6,2 6,5 6,8 7,6 8,5 9,3Tabela 3.34 – Lins: Previsão <strong>de</strong> máximas alturas <strong>de</strong> chuvas, <strong>em</strong> mmDuração tPerío<strong>do</strong> <strong>de</strong> retorno T (anos)(minutos) 2 5 10 15 20 25 50 100 20010 17,5 20,9 23,2 24,4 25,3 26,0 28,1 30,2 32,220 28,4 34,4 38,4 40,6 42,2 43,4 47,2 50,9 54,630 35,8 44,0 49,4 52,4 54,6 56,2 61,3 66,3 71,360 48,7 61,4 69,9 74,6 78,0 80,5 88,4 96,3 104,1120 60,0 77,8 89,7 96,3 101,0 104,6 115,7 126,7 137,7180 65,4 86,2 99,9 107,7 113,1 117,3 130,2 143,0 155,7360 72,9 98,1 114,8 124,2 130,8 135,8 151,5 167,0 182,4720 78,7 107,6 126,7 137,5 145,0 150,8 168,7 186,5 204,21080 81,6 112,3 132,7 144,2 152,2 158,4 177,5 196,4 215,21440 83,5 115,5 136,7 148,6 157,0 163,4 183,2 202,9 222,5
65T = 2 T = 5 T = 10 T = 25 T = 50 T = 100 T = 200250200150i (mm/h)1005000 200 400 600 800 1000 1200 1400 1600Duração t (min.)Figura 3.33 - LINS: CURVAS I-D-F EM FUNÇÃO DO PERÍODO T(ANOS)