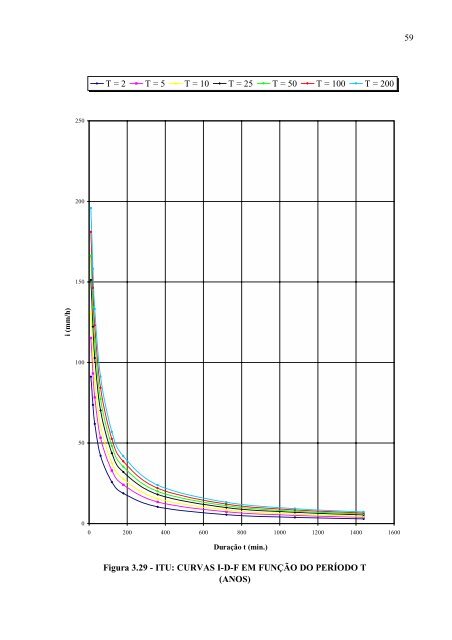
583.4.14 Relação intensida<strong>de</strong> – duração – perío<strong>do</strong> <strong>de</strong> retorno para ItuNome da estação: Pirapitingui – E4-023RCoor<strong>de</strong>nadas geográficas: Lat. 23°20’S; Long. 47°20’WAltitu<strong>de</strong>:640 mPerío<strong>do</strong> <strong>de</strong> da<strong>do</strong>s utiliza<strong>do</strong>s: 1973-84; 1986-89; 1991-94; 1997 (21 anos)Equação: i t,T = 52,9364 (t+30) –0,9526 + 8,0659 (t+25) –0,8537 .[–0,4793–0,9126 ln ln(T/T–1)] (3.21)para 10 ≤ t ≤ 1440com: i: intensida<strong>de</strong> da chuva, correspon<strong>de</strong>nte à duração t e perío<strong>do</strong> <strong>de</strong> retorno T, <strong>em</strong> mm/min;t: duração da chuva <strong>em</strong> minutos;T: perío<strong>do</strong> <strong>de</strong> retorno <strong>em</strong> anos.Tabela 3.29 – Itu: Previsão <strong>de</strong> máximas intensida<strong>de</strong>s <strong>de</strong> chuvas, <strong>em</strong> mm/hDuração tPerío<strong>do</strong> <strong>de</strong> retorno T (anos)(minutos) 2 5 10 15 20 25 50 100 20010 91,2 115,3 131,2 140,2 146,5 151,3 166,3 181,1 195,820 73,7 93,2 106,0 113,3 118,3 122,3 134,3 146,3 158,230 62,0 78,3 89,2 95,3 99,6 102,9 113,0 123,1 133,160 42,1 53,4 60,8 65,1 68,0 70,3 77,3 84,2 91,2120 25,8 33,0 37,7 40,4 42,3 43,7 48,2 52,6 56,9180 18,7 24,1 27,6 29,6 31,0 32,0 35,3 38,6 41,9360 10,4 13,5 15,5 16,7 17,5 18,1 20,1 22,0 23,9720 5,5 7,3 8,5 9,1 9,6 10,0 11,1 12,2 13,21080 3,8 5,1 5,9 6,4 6,7 7,0 7,8 8,5 9,31440 2,9 3,9 4,6 4,9 5,2 5,4 6,0 6,6 7,2Tabela 3.30 – Itu: Previsão <strong>de</strong> máximas alturas <strong>de</strong> chuvas, <strong>em</strong> mmDuração tPerío<strong>do</strong> <strong>de</strong> retorno T (anos)(minutos) 2 5 10 15 20 25 50 100 20010 15,2 19,2 21,9 23,4 24,4 25,2 27,7 30,2 32,620 24,6 31,1 35,3 37,8 39,4 40,8 44,8 48,8 52,730 31,0 39,2 44,6 47,6 49,8 51,4 56,5 61,5 66,660 42,1 53,4 60,8 65,1 68,0 70,3 77,3 84,2 91,2120 51,7 66,0 75,5 80,8 84,5 87,4 96,3 105,1 113,9180 56,2 72,2 82,8 88,7 92,9 96,1 106,0 115,8 125,6360 62,2 80,9 93,2 100,2 105,0 108,8 120,4 131,8 143,3720 66,6 87,8 101,8 109,8 115,3 119,6 132,8 145,8 158,91080 68,6 91,4 106,4 114,9 120,8 125,4 139,5 153,5 167,51440 69,9 93,8 109,5 118,4 124,7 129,5 144,2 158,9 173,5
59T = 2 T = 5 T = 10 T = 25 T = 50 T = 100 T = 200250200150i (mm/h)1005000 200 400 600 800 1000 1200 1400 1600Duração t (min.)Figura 3.29 - ITU: CURVAS I-D-F EM FUNÇÃO DO PERÍODO T(ANOS)