The Fiscal Impact of a Corporate The High & Individual Cost of Maryland’s Tax Credit Scholarship Dropout Program Rates on the State of Indianato cost savings even if demand for the program is low. The maximum cost savings will be realized when the average scholarshipamount is $1,250 for a program with a $5 million cap. There are no scenarios where there may be a real threat of the program notachieving revenue neutrality by year five.Table 9 displays the fiscal impact estimates in the first five years of the program under the moderate demand assumption. Theprogram is not revenue neutral in 2009-2010 because the state’s declining enrollment adjustment dampers the real public educationenrollment decline that results from the program. However, by year three, all program designs are estimated to result in cost savingsto the state, and in most scenarios, positive results are seen in year two.Recall that target efficiency (i.e. the proportion of scholarships going to help students migrate from public schools to privateschools) is maximized when the average scholarship amounts is $5,000. We predict that the program will be revenue neutral in yearfive when target efficiency is maximized. Therefore, policymakers could choose to distribute scholarships of larger dollar amounts,which would induce the greatest amount of demand from Indiana’s low-income students, without concern that the program wouldlead to additional costs to the state.Figure 4Net Fiscal Impact in Year 5 for $5 Million Cap with 50% Matching Rate$80$70$60High DemandModerate DemandLow Demand$50MILLIONS$40$30$20$10$0-$10-$205,000 4,750 4,500 4,250 4,000 3,750 3,500 3,250 2,750 2,500 2,250 2,000 1,750 1,500 1,250 1,000 750 500SCHOLARSHIP VALUETable 9Fiscal Impact of a Tax-Credit Scholarship Program on the State (Millions)Moderate Demand Scenario $5 Million Cap with 50% Matching Rate, with 5 Year Declining Enrollment Adjustment RateYear $5,000$4,750$4,500$4,250$4,000$3,750$3,500$3,250$3,000$2,750$2,500$2,250$2,000$1,750$1,500$1,250$1,000$750$5002009-2010($2.9) ($2.8) ($2.7) ($2.6) ($2.5) ($2.4) ($2.2) ($2.0) ($1.8) ($1.6) ($1.3) ($1.0) ($0.6) ($0.2)$0.3$1.0$1.9$3.1$4.72010-2011($0.7) ($0.6) ($0.3) ($0.1)$0.1$0.4$0.7$1.1$1.5$1.9$2.4$3.0$3.6$4.4$5.2$6.1$7.1$8.8$8.82011-2012$1.6$1.9$2.2$2.5$2.9$3.3$3.8$4.3$4.9$5.6$6.3$7.1$8.0$9.0$10.1$11.2$12.0$13.4$13.02012-2013$4.0$4.4$4.9$5.3$5.8$6.4$7.0$7.7$8.5$9.4$10.3$11.4$12.5$13.8$15.0$16.1$16.8$14.3$12.32013-2014$6.4$6.9$7.4$8.0$8.6$9.3$10.0$10.8$11.7$12.7$13.7$14.8$15.9$16.9$17.6$17.6$16.6$14.0$9.818 April 2009
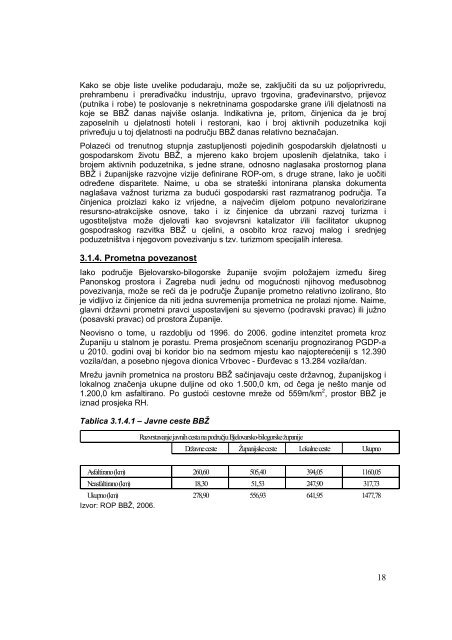
Generalno gledano, može se konstatirati je da cestovna mreža Županije izrazitorazgranata. O velikoj kilometraži lokalnih cesta najbolje svjedoči omjer lokalnih ižupanijskih cesta u odnosu prema drugim županijama. Naime, za razliku od drugihžupanija gdje je omjer lokalnih i županijskih cesta 1:1 pa sve do 1:2, na područjuBBŽ on je 2:1. S druge strane, meñutim, riječ je uglavnom o cestama niže kategorije(županijske i lokalne), što uvelike relativizira gornji zaključak.Istodobno, kvaliteta najvećeg broja cesta je jedva zadovoljavajuća, a godinama jeprisutan nesrazmjer izmeñu potrebnih i osiguranih sredstava kako za redovno, tako iza pojačano održavanje, odnosno sanaciju i rekonstrukciju kolnika. To se osobitoodnosi na ceste nižeg ranga. Potreba izgradnje nogostupa uz cestu kroz naselja idalje predstavlja nerješiv problem za većinu naselja.Državne cesteProstor Županije je relativno ravnomjerno pokriven mrežom državnih cesta, ali je tozbog njihovih tehničkih karakteristika u odnosu na paralelne prometne pravce, južno isjeverno od BBŽ, nedostatno za značajnije uključenje ovog prostora u državne imeñunarodne tokove roba i usluga. Mrežu državnih cesta na području Županije činepravci: Zagreb-Bjelovar-Daruvar-Pakrac, odnosno Vrbovec-Čazma-Garešnica-Pakrac,koji su paralelni sa podravskim i posavskim pravcem odnosno pravci: Ivanić Grad-Čazma-Bjelovar-ðurñevac, Kutina-Garešnica-Grubišno Polje-Virovitica, i Pakrac-Daruvar-ðulovac-Slatinakoji su okomiti na podravski i posavski pravac i meñusobno ih povezuju. Stanje ovihcesta je na pojedinim dionicama vrlo loše. Drugim riječima, državne ceste čestosamo deklarativno nose svoj naziv, dok po tehničkim karakteristikama ne bi moglezadovoljiti kategorizaciju u koju su svrstane. Nadalje, državne ceste i danas prolazekroz brojna manja i veća naselja Županije čime je promet bitno usporen i manjesiguran.Županijske ceste i lokalne cesteGusta i dobro uspostavljena mreža županijskih i lokalnih cesta na prostoru BBŽ,neovosno o njihovoj kvaliteti, preduvet je kako ravnomjernog razvitka Županije, tako idinamiziranja gospodarskog razvoja u budućnosti. U tom smislu, a osim njihovogkvalitetnijeg održavanja, pojedine će pravce biti potrebno modernizirati, odnosnokritične dionice rekonstruirati.ŽeljeznicaOsnovu sadašnjeg prometa željeznicom na području Županije čini pruga Bjelovar –Križevci (Zagreb), koja nakon izvršene rekonstrukcije ima poboljšane tehničko –eksploatacijske značajke na relaciji Bjelovar – Sv. Ivan Žabno (80 km/h, 200 KN/os).Neovisno o tome, meñutim vožnja od Zagreba do Bjelovara traje dva sata, amjestimično je maksimalna moguća brzina svega 50 km/h. Nadalje, riječ je o tzv.sporednoj pruzi, a presjecaju je brojne, uglavnom lokalne prometnice. Na trasi prugeuspostavljeno je 39 cestovnih prijelaza koji su dobrim djelom nezaštićeni ipredstavljaju sigurnosni problem kako u željezničkom, tako i u cestovnom prometu.19
- Page 3 and 4: 4.3. ZAKLJUČNA RAZMATRANJA........
- Page 5: ilogorskežupanijeBjelovarskobilogo
- Page 10 and 11: ponude potrebnih ponajviše za priv
- Page 12 and 13: Nadalje, s obzirom na vrijedne prir
- Page 15 and 16: 39 ribnjaka. Ribnjacima momentalno
- Page 17: Generalno gledano, a što se tiče
- Page 21 and 22: vodoopskrbna zona „Daruvar“ - u
- Page 23 and 24: 3.2.6. Gospodarenje otpadomOrganizi
- Page 25: Biljni svijet Životinjski svijet Z
- Page 28 and 29: Najzastupljeniji su hrast kitnjak,
- Page 30 and 31: Izletište Bara u slijedećih bi ne
- Page 32 and 33: 7.4.8. Župna crkva sv. Benedikta -
- Page 34 and 35: 8.5.2. Kušaonica "Badel 1862“ d.
- Page 36 and 37: 10.1.18. Proljeće u Trojstvu - Vel
- Page 38 and 39: 13.3.1. Termalni vodeni park AQUAE
- Page 40 and 41: Tablica 3.4.1.1 - Smještajni kapac
- Page 42 and 43: Nadalje, u odnosu na 2003. godinu k
- Page 44 and 45: deset emitivnih tržišta za podru
- Page 46 and 47: Iako nema značajnije razlike u soc
- Page 48 and 49: aktivnost. Iznimku, donekle, predst
- Page 50 and 51: 4. ANALIZA TRŽIŠTARazvoj turizma
- Page 52 and 53: Tablica 4.1.1 - nastavakFaktoriPosl
- Page 54 and 55: 4.2 Identifikacija potencijalne tr
- Page 56 and 57: Tablica 4.2.2 - Procjena broja jedn
- Page 58 and 59: žene u ranim 50-tim godinama, koje
- Page 60 and 61: iznajmljivanje oružja• prilagoñ
- Page 62 and 63: Ruralni turizamPotražnju za ruraln
- Page 64 and 65: Turizam vinaKonzumacija vina kao i
- Page 66 and 67: Broj planinara koji nisu učlanjeni
- Page 68 and 69:
ispunjava njihova očekivanja. Manj
- Page 70 and 71:
Tržište kulturnog turizmaza rekre
- Page 72 and 73:
doživljajem. Ove rute mogu biti te
- Page 74 and 75:
5. SWOT ANALIZA5.1. UvodNa temelju
- Page 76 and 77:
svojevrsnom hendikepu, neovisno o r
- Page 78 and 79:
valja pridodati i padajuću razinu
- Page 80 and 81:
SWOT analiza posvećena ljudskim po
- Page 82 and 83:
ORGANIZACIJA, UPRAVLJANJE I POTICAN
- Page 84 and 85:
6. STRATEŠKA VIZIJA, MISIJA I CILJ
- Page 86 and 87:
diverzifikacija turističkih iskust
- Page 88 and 89:
poboljšavati stupanj zadovoljstva
- Page 90 and 91:
Povećanje broja, unapreñenje razn
- Page 92 and 93:
ciljeva, ni važnost pojedinih proj
- Page 94 and 95:
iskomunicirane vlastite konkurentsk
- Page 96 and 97:
8. TRŽIŠNO POZICIONIRANJE BBŽ8.1
- Page 98 and 99:
prepoznatljiva tradicionalna kultur
- Page 100 and 101:
pitomi obronci Moslavačke gore izu
- Page 102 and 103:
9. PRIORITETNI TURISTIČKI PROIZVOD
- Page 104 and 105:
pregovaračka snaga na strani kupac
- Page 106 and 107:
6. Kulturni turizam.S druge strane,
- Page 108 and 109:
9.5. Tržišni potencijal turistič
- Page 110 and 111:
10. KAKO DALJE?Područje Bjelovarsk


