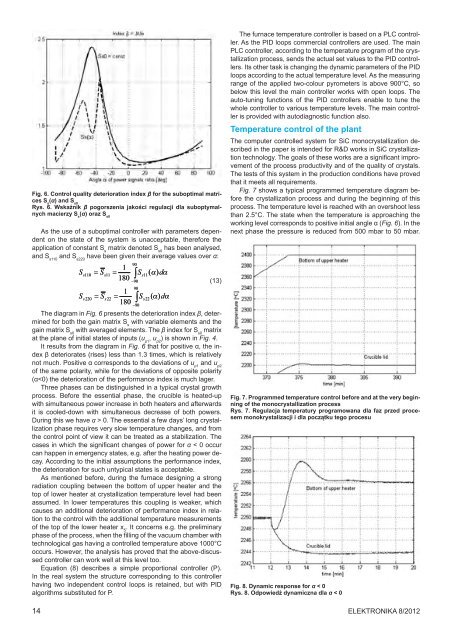
Fig. 6. Control quality deterioration index β for the suboptimal matricesS s(α) and S s0Rys. 6. Wskaźnik β pogorszenia jakości regulacji dla suboptymalnychmacierzy S s(α) oraz S s0As the use of a suboptimal controller with parameters dependenton the state of the system is unacceptable, therefore theapplication of constant S smatrix denoted S s0has been analysed,and S s110and S s220have been given their average values over α:901Ss110=Ss11= ∫Ss11( α)dα180−90(13)901Ss220=Ss22=∫Ss22( α)dα180−90The diagram in Fig. 6 presents the deterioration index β, determinedfor both the gain matrix S swith variable elements and thegain matrix S s0with averaged elements. The β index for S s0matrixat the plane of initial states of inputs (u p1, u p2) is shown in Fig. 4.It results from the diagram in Fig. 6 that for positive α, the indexβ deteriorates (rises) less than 1.3 times, which is relativelynot much. Positive α corresponds to the deviations of u p1and u p2of the same polarity, while for the deviations of opposite polarity(α 0. The essential a few days’ long crystallizationphase requires very slow temperature changes, and fromthe control point of view it can be treated as a stabilization. Thecases in which the significant changes of power for α < 0 occurcan happen in emergency states, e.g. after the heating power decay.According to the initial assumptions the performance index,the deterioration for such untypical states is acceptable.As mentioned before, during the furnace designing a strongradiation coupling between the bottom of upper heater and thetop of lower heater at crystallization temperature level had beenassumed. In lower temperatures this coupling is weaker, whichcauses an additional deterioration of performance index in relationto the control with the additional temperature measurementsof the top of the lower heater x 5. It concerns e.g. the preliminaryphase of the process, when the filling of the vacuum chamber withtechnological gas having a controlled temperature above 1000°Coccurs. However, the analysis has proved that the above-discussedcontroller can work well at this level too.Equation (8) describes a simple proportional controller (P).In the real system the structure corresponding to this controllerhaving two independent control loops is retained, but with PIDalgorithms substituted for P.14The furnace temperature controller is based on a PLC controller.As the PID loops commercial controllers are used. The mainPLC controller, according to the temperature program of the crystallizationprocess, sends the actual set values to the PID controllers.Its other task is changing the dynamic parameters of the PIDloops according to the actual temperature level. As the measuringrange of the applied two-colour pyrometers is above 900°C, sobelow this level the main controller works with open loops. Theauto-tuning functions of the PID controllers enable to tune thewhole controller to various temperature levels. The main controlleris provided with autodiagnostic function also.Temperature control of the plantThe computer controlled system for SiC monocrystallization describedin the paper is intended for R&D works in SiC crystallizationtechnology. The goals of these works are a significant improvementof the process productivity and of the quality of crystals.The tests of this system in the production conditions have provedthat it meets all requirements.Fig. 7 shows a typical programmed temperature diagram beforethe crystallization process and during the beginning of thisprocess. The temperature level is reached with an overshoot lessthan 2.5°C. The state when the temperature is approaching theworking level corresponds to positive initial angle α (Fig. 6). In thenext phase the pressure is reduced from 500 mbar to 50 mbar.Fig. 7. Programmed temperature control before and at the very beginningof the monocrystallization processRys. 7. Regulacja temperatury programowana dla faz przed procesemmonokrystalizacji i dla początku tego procesuFig. 8. Dynamic response for α < 0Rys. 8. Odpowiedź dynamiczna dla α < 0<strong>Elektronika</strong> 8/<strong>2012</strong>
The temperature deviations from the set values during this periodare below the measurement background level.To examine the system dynamic properties in non-typical workconditions, a test of the temperature changes for the initial statecorresponding to negative values of α has been done. At the beginningthe stabilization of the two controlled points at 2250°C hasbeen obtained. Then the step changes of the set values has beenapplied in opposite increments Δx 3= –6°C and Δx 4= +6°C. Thesechanges correspond to the initial state for α = –42° (Fig. 6). Thetransient response for this case is shown in Fig. 8. According tothe analysis the overshoots are larger than those in Fig. 7. In suchcases the settling time of the temperature is short, referring to theduration of the process and these cases are incidental only, sotheir influence on the process results can be ignored.SummaryThis paper presents the solution of a suboptimal controller orientedon the designed thermal system and technological processunder way. The construction of the system in question is innovativeand rather unconventional, thus the control had to be workedout from the very basis. The solution is based on a numericalmodel of temperature field in the furnace prepared for the constructionpurposes. For the controller synthesis this model hasbeen simplified to a sixth-order model.The criterion of the suboptimal controller structure choice wasthe value of the linear quadratic infinite horizon performance index.The simulation of the state vector and input vector trajectorieshas been applied for the gain matrix optimization.The analysis proved that by making use of a strong thermalcoupling between the upper and the lower heater, the control canbe based on two points of temperature measurements located inthe centers of respectively the crucible lid and the bottom of upperheater. The temperatures of these two points allow the determinationof the crystallization process conditions.Finally the structure of suboptimal controller with two singlefeedback loops has been chosen. The simulation of typical dynamicstates for crystallization process (α > 0) has shown that theperformance index doesn’t rise more that by 30% in relation to itsoptimal value. It can be bigger for non-typical states but it doesn’thave any significant consequences.Precise numerical modeling of the temperature field in thefurnace and simulation of its control in the preliminary phase ofthe project has enabled us to obtain good conformity of the plantparameters obtained with those assumed [9]. Such an approachfacilitated a simplification of construction, gave the cost reductionand improved the plant reliability. Furthermore it was possible toavoid extra expenses that could have ensued from the inevitablefault rectifications of a crudely designed plant, obtained withoutusage of such advanced means.The presented method of the suboptimal controller choice canbe expanded over more complex cases e.g. furnaces with threesectionheaters. The problem can be solved with Nelder-Meadsimplex method [8] application also.This work is a part of the project supported by the Polish Ministryof Science and Higher Education under contract No. R<strong>08</strong> 043 02.References[1] Chen Q.-S., Zhang H., Prasad V., Balkas C.M., Yushin N.K., WangS.: Kinetics and modeling of sublimation growth of silicon carbidebulk crystal, Journal of Crystal Growth, No. 266 pp. 320–326, 2004,Elsevier.[2] Chen Q.-S. , Gao P., Hu W.R.: Effects of induction heating on temperaturedistribution and growth rate in large-size SiC growth system,Journal of Crystal Growth 266, pp. 320–326, 2004.[3] Drachev R., Deyneka E., Rhodes C., Schupp J., Sudarshan T.: FundamentalLimitation of SiC PVT Growth Reactors with CylindricalHeaters, Materials Science Forum, 2006, Vols. 527–529, pp. 15–20.[4] Orzyłowski M.: Electric Furnace: A Case Study of Optimal Controlof Dynamic Systems with Delays, Systems Science, vol. 21, No. 4,pp. 69–79, Wrocław, 1995.[5] Orzyłowski M.: Order Reduction of the Controller Gain Matrix for theMultivariable Thermal Plant with Time-Delays, Systems Science, vol.22, No. 1, pp. 85–95, Wrocław, 1996.[6] Peres P. L. D., Geromel J. C.: An Alternate Numerical Solution to theLinear Quadratic Problem, IEEE Transactions on Automatic Control,Vol. 39, 1994, pp. 198-202.[7] Siegel R., Howell J., Thermal Radiation Heat transfer, Taylor &Francis,2002[8] Lagarias, J.C., Reeds J. A., Wright M. H., Wright P. E.: ConvergenceProperties of the Nelder-Mead Simplex Method in Low Dimensions,SIAM Journal of Optimization, Vol. 9 No. 1, pp. 112–147, 1998.[9] Grasza K., Tymicki E., Racka K., Orzyłowski M.: Experimental Verificationof a Novel System for the Growth of SiC Single Crystals,Materials Science Forum, Vols. 679–680, 2011, pp. 16–19.Eksperymentalna walidacja elektromechanicznych modeliultradźwiękowych przetworników piezoceramicznychprof. dr hab. inż. Andrzej Milewski, mgr inż. Paweł Kogut, mgr inż. Witold Kardyś,mgr inż. Piotr Kluk<strong>Instytut</strong> Tele- i Radiotechniczny, WarszawaPiezoceramika od wielu lat jest materiałem wykorzystywanym dobudowy przetworników ultradźwiękowych dużej mocy ze względuna ich bardzo dobre parametry, jak chociażby dużą sprawnośći zdolność energetyczną oraz wytrzymałość mechaniczną. Naj-Rys. 1. Piezoceramiczne przetworniki ultradźwiękoweFig. 1. Piezoceramic ultrasonic transducersczęściej stosowana jest ceramika o geometrii walcowej wstępniespolaryzowana w kierunku osiowym. Przykłady opisanych przetwornikówpiezocermicznych zaprezentowano na rys. 1.Przetworniki ultradźwiękowe projektowane są na zadane parametry,takie jak częstotliwość pracy czy moc wyjściowa. Doprojektowania technicznego przetwornika ultradźwiękowego potrzebnyjest model matematyczny, który pozwoli na wstępną estymacjęwymaganych parametrów, w tym parametrów elementówskładowych takich jak przetwornik piezoceramiczny. Model przetwornikapiezoceramicznego jest również niezbędny do walidacjiparametrów piezoceramiki dostarczonej od producenta, co jestszczególnie ważne ze względu na rozrzut technologiczny, któryjak podają niektórzy producenci standardowo wynosi ~20%.W niniejszym artykule skupiono się na opisie elektromechanicznegomodelu dla przypadku drgań osiowych oraz na metodachestymacji parametrów statycznych przetworników piezoceramicznychw oparciu o pomiary charakterystyk impedancyjnych.<strong>Elektronika</strong> 8/<strong>2012</strong> 15