Download - IVT - ETH Zürich
Download - IVT - ETH Zürich
Download - IVT - ETH Zürich

Erfolgreiche ePaper selbst erstellen
Machen Sie aus Ihren PDF Publikationen ein blätterbares Flipbook mit unserer einzigartigen Google optimierten e-Paper Software.
Forschungsarbeiten<br />
2.3 Methodology for evaluating cost and accuracy<br />
of parking patrol surveys<br />
Gruppe Strassenverkehrstechnik<br />
In patrol surveys, patrolling observers check the parking area every δ minutes (i.e., at fixed time intervals)<br />
and record the plate number of the car occupying each stall. To find the average parking duration T – , an estimated<br />
value T˜ is obtained by averaging the duration of each car observed. Although the results are biased<br />
because of known reasons (i.e., short duration parkers are under sampled; and the duration of an observed<br />
vehicle is only approximate), the survey accuracy is unknown, making it impossible to evaluate the survey.<br />
However, very often, a trade-off between survey accuracy and survey cost must be made. By analyzing the<br />
relation between the error and relative labor cost, we provide several suggestions to practitioners to help<br />
them obtain high quality results from the patrol survey while keeping costs to a minimum.<br />
By defining three dimensionless variables: survey intensity X , survey error Y, and relative cost Z, the relation<br />
between those three key elements can be further analyzed.<br />
• X defines the level of checking frequency based on individual parking areas<br />
• Y measures the error of the estimated average parking duration compared to the real value<br />
• Z reflects the labor cost of the survey<br />
Given a parking area, a higher checking frequency (i.e., a larger X) corresponds to a smaller error (i.e., a<br />
smaller Y), but it requires a higher budget (i.e., a larger Z). The value of X ranges from 0 to 1, X = 1 is equivalent<br />
to continuous observation (e.g., video camera), the survey contains perfect parking information, so<br />
survey error Y=0. The relation among X, Y and Z can be found based on our analysis. The key factor to the<br />
relation is the shape parameter of gamma distribution, k. This can be suggested or assumed based on<br />
parking purpose, land use information, etc.<br />
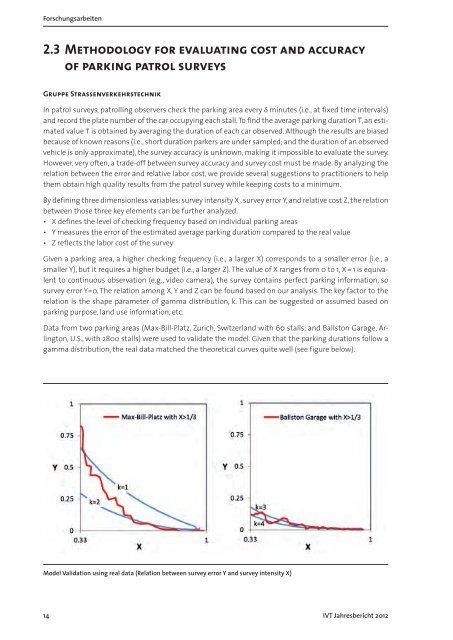
Data from two parking areas (Max-Bill-Platz, Zurich, Switzerland with 60 stalls; and Ballston Garage, Arlington,<br />
U.S., with 2800 stalls) were used to validate the model. Given that the parking durations follow a<br />
gamma distribution, the real data matched the theoretical curves quite well (see figure below).<br />
Model Validation using real data (Relation between survey error Y and survey intensity X)<br />
14 <strong>IVT</strong> Jahresbericht 2012