Gas Disks and Supermassive Black Holes in Nearby Radio Galaxies
Gas Disks and Supermassive Black Holes in Nearby Radio Galaxies
Gas Disks and Supermassive Black Holes in Nearby Radio Galaxies

Create successful ePaper yourself
Turn your PDF publications into a flip-book with our unique Google optimized e-Paper software.
(a)<br />
(b) (i)<br />
(ii)<br />
(c)<br />
(i) (ii) (iii) (iv)<br />
(d)<br />
(i) (ii)<br />
(e)<br />
(i) (ii) (iii) (iv)<br />
Intensity (erg s −1 cm −2 Å −1 arcsec −2 )<br />
v r (km s −1 )<br />
8•10 −15<br />
6•10 −15<br />
4•10 −15<br />
2•10 −15<br />
4700<br />
4600<br />
4500<br />
4400<br />
4300<br />
4200<br />
4100<br />
0<br />
Reduced 2−D Spectrum<br />
S<strong>in</strong>gle Gaussian per L<strong>in</strong>e Fit<br />
v r<br />
X = −0.2<br />
Y (arcsec)<br />
Hα+[NII] & [SII] − Narrow L<strong>in</strong>e Fit<br />
0.91<br />
0.41<br />
−0.10<br />
−0.61<br />
σ gas<br />
v r<br />
+0.2 0.0 −0.2<br />
X (arcsec)<br />
−2•10<br />
6584 6638 6691 6745 6799 6852 6906<br />
Wavelength (Angstroms)<br />
−15<br />
X = 0.0<br />
X = +0.2<br />
−1.01 −0.34 0.34 1.01<br />
Y (arcsec)<br />
σ gas (km s −1 )<br />
500<br />
400<br />
300<br />
200<br />
100<br />
0<br />
X = −0.2<br />
X = 0.0<br />
X = +0.2<br />
−1.01 −0.34 0.34 1.01<br />
Y (arcsec)<br />
Intensity (erg s −1 cm −2 Å −1 arcsec −2 )<br />
F (10 −14 ergs s −1 cm −2 Hz −1 )<br />
8•10 −15<br />
6•10 −15<br />
4•10 −15<br />
2•10 −15<br />
0.5<br />
0.4<br />
0.3<br />
0.2<br />
0.1<br />
0.0<br />
10<br />
8<br />
6<br />
4<br />
2<br />
0<br />
0.4<br />
0.3<br />
0.2<br />
0.1<br />
0<br />
σ gas<br />
+0.2 0.0 −0.2<br />
X (arcsec)<br />
[NII] 6585 Flux<br />
X = −0.2<br />
X = 0.0<br />
X = +0.2<br />
0.0<br />
−0.1<br />
−1.01 −0.34 0.34 1.01<br />
Y (arcsec)<br />
F([NII] 6585)<br />
+0.2 0.0 −0.2<br />
X (arcsec)<br />
Hα+[NII] & [SII] − Narrow & Broad Cpt. Fit<br />
[NII] 6585/Hα<br />
10.0<br />
1.0<br />
0.1<br />
F([NII])/F(Hα)<br />
+0.2 0.0 −0.2<br />
X (arcsec)<br />
−2•10<br />
6584 6638 6691 6745 6799 6852 6906<br />
Wavelength (Angstroms)<br />
−15<br />
[NII]/Hα<br />
X = −0.2<br />
X = 0.0<br />
X = +0.2<br />
−1.01 −0.34 0.34 1.01<br />
Y (arcsec)<br />
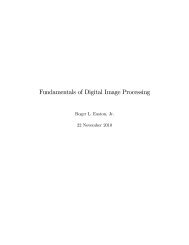
Figure 3.1 Key to plots. Region (a): the HST acquisition image for each galaxy<br />
observed is shown with the positions of the observed long slits overlaid. The relative<br />
position angles of the galaxy major axes measured from the central isophotes (dashed<br />
l<strong>in</strong>es) <strong>and</strong> the arcsecond scale radio jets (dotted l<strong>in</strong>es) are shown. These l<strong>in</strong>es cross,<br />
<strong>and</strong> a North-East <strong>in</strong>dicator is drawn, at the location of the central pixel (see text).<br />
Region (b): (i) the central portion of the reduced 2-D spectrum from the central<br />
slit position is shown along with (ii) an image created from fitt<strong>in</strong>g a set of 5 Gaussian<br />
l<strong>in</strong>es to the same. Region (c): plots represent<strong>in</strong>g the two-dimensional distributions<br />
of parameters measured by fitt<strong>in</strong>g a one Gaussian per emission l<strong>in</strong>e model to spectra<br />
from the nuclear region. The dashed <strong>and</strong> dash-dot l<strong>in</strong>es <strong>in</strong>dicate the directions of the<br />
m<strong>in</strong>or <strong>and</strong> major axes respectively. The l<strong>in</strong>es cross at the location of the central pixel.<br />
We show: (i) radial velocity (filled circles represent velocities greater than the mean,<br />
empty circles represent velocities less than the mean <strong>and</strong> the radius of each po<strong>in</strong>t [i,j]<br />
is proportional to |vi,j − vmean|); (ii) velocity dispersion (the radius of the circle is<br />
proportional to σi,j); (iii) <strong>in</strong>tegrated l<strong>in</strong>e flux (the area of each po<strong>in</strong>t is proportional<br />
to Fi,j); <strong>and</strong> (iv) [N II]6585 / Hα ratio (The radius of each circle is proportional to<br />
log(F([N II]6585)/F(Hα))). Region (d): s<strong>in</strong>gle Gaussian per l<strong>in</strong>e fit <strong>and</strong> residuals<br />
without (i) <strong>and</strong> with (ii) the additional free component described <strong>in</strong> the text for the<br />
central spectrum of each galaxy. Region (e): plots of (i) radial velocity, (ii) velocity<br />
dispersion, (iii) [N II] l<strong>in</strong>e flux <strong>and</strong> (iv) [N II]6585 / Hα ratio along each slit measured<br />
by fitt<strong>in</strong>g a one Gaussian per l<strong>in</strong>e model to the emission l<strong>in</strong>e spectra. The vertical<br />
dotted l<strong>in</strong>e <strong>in</strong>dicates the Y position of the central row. The dash-dot l<strong>in</strong>e <strong>in</strong> the<br />
velocity panel <strong>in</strong>dicates the quoted recession velocity for the galaxy (see Table 2.1).<br />
0.5"<br />
121