

The Changing Structure of the Electric Power Industry 2000: An ... - EIA
The Changing Structure of the Electric Power Industry 2000: An ... - EIA
The Changing Structure of the Electric Power Industry 2000: An ... - EIA

You also want an ePaper? Increase the reach of your titles
YUMPU automatically turns print PDFs into web optimized ePapers that Google loves.
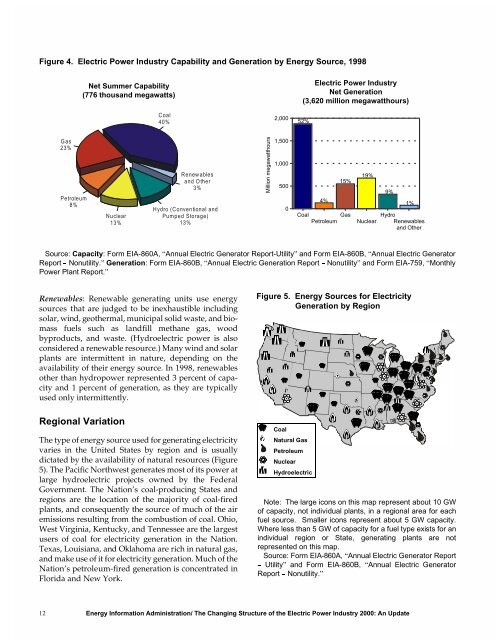
Figure 4. <strong>Electric</strong> <strong>Power</strong> <strong>Industry</strong> Capability and Generation by Energy Source, 1998<br />
12<br />
Gas<br />
23%<br />
Petroleum<br />
8%<br />
Net Summer Capability<br />
(776 thousand megawatts)<br />
Nuclear<br />
13%<br />
Coal<br />
40%<br />
Renewables<br />
and O<strong>the</strong>r<br />
3%<br />
Hydro (Conventional and<br />
Pumped Storage)<br />
13%<br />
Renewables: Renewable generating units use energy<br />
sources that are judged to be inexhaustible including<br />
solar, wind, geo<strong>the</strong>rmal, municipal solid waste, and biomass<br />
fuels such as landfill methane gas, wood<br />
byproducts, and waste. (Hydroelectric power is also<br />
considered a renewable resource.) Many wind and solar<br />
plants are intermittent in nature, depending on <strong>the</strong><br />
availability <strong>of</strong> <strong>the</strong>ir energy source. In 1998, renewables<br />
o<strong>the</strong>r than hydropower represented 3 percent <strong>of</strong> capacity<br />
and 1 percent <strong>of</strong> generation, as <strong>the</strong>y are typically<br />
used only intermittently.<br />
Regional Variation<br />
<strong>The</strong> type <strong>of</strong> energy source used for generating electricity<br />
varies in <strong>the</strong> United States by region and is usually<br />
dictated by <strong>the</strong> availability <strong>of</strong> natural resources (Figure<br />
5). <strong>The</strong> Pacific Northwest generates most <strong>of</strong> its power at<br />
large hydroelectric projects owned by <strong>the</strong> Federal<br />
Government. <strong>The</strong> Nation’s coal-producing States and<br />
regions are <strong>the</strong> location <strong>of</strong> <strong>the</strong> majority <strong>of</strong> coal-fired<br />
plants, and consequently <strong>the</strong> source <strong>of</strong> much <strong>of</strong> <strong>the</strong> air<br />
emissions resulting from <strong>the</strong> combustion <strong>of</strong> coal. Ohio,<br />
West Virginia, Kentucky, and Tennessee are <strong>the</strong> largest<br />
users <strong>of</strong> coal for electricity generation in <strong>the</strong> Nation.<br />
Texas, Louisiana, and Oklahoma are rich in natural gas,<br />
and make use <strong>of</strong> it for electricity generation. Much <strong>of</strong> <strong>the</strong><br />
Nation’s petroleum-fired generation is concentrated in<br />
Florida and New York.<br />
Figure 5. Energy Sources for <strong>Electric</strong>ity<br />
Generation by Region<br />
Energy Information Administration/ <strong>The</strong> <strong>Changing</strong> <strong>Structure</strong> <strong>of</strong> <strong>the</strong> <strong>Electric</strong> <strong>Power</strong> <strong>Industry</strong> <strong>2000</strong>: <strong>An</strong> Update<br />
Million megawatthours<br />
2,000<br />
1,500<br />
1,000<br />
500<br />
0<br />
52%<br />
Coal<br />
Natural Gas<br />
Petroleum<br />
Nuclear<br />
Hydroelectric<br />
<strong>Electric</strong> <strong>Power</strong> <strong>Industry</strong><br />
Net Generation<br />
(3,620 million megawatthours)<br />
4%<br />
15%<br />
Coal<br />
Gas<br />
Petroleum<br />
19%<br />
Nuclear<br />
9%<br />
1%<br />
Hydro<br />
Renewables<br />
and O<strong>the</strong>r<br />
Source: Capacity: Form <strong>EIA</strong>-860A, “<strong>An</strong>nual <strong>Electric</strong> Generator Report-Utility” and Form <strong>EIA</strong>-860B, “<strong>An</strong>nual <strong>Electric</strong> Generator<br />
Report � Nonutility.” Generation: Form <strong>EIA</strong>-860B, “<strong>An</strong>nual <strong>Electric</strong> Generation Report � Nonutility” and Form <strong>EIA</strong>-759, “Monthly<br />
<strong>Power</strong> Plant Report.”<br />
Note: <strong>The</strong> large icons on this map represent about 10 GW<br />
<strong>of</strong> capacity, not individual plants, in a regional area for each<br />
fuel source. Smaller icons represent about 5 GW capacity.<br />
Where less than 5 GW <strong>of</strong> capacity for a fuel type exists for an<br />
individual region or State, generating plants are not<br />
represented on this map.<br />
Source: Form <strong>EIA</strong>-860A, “<strong>An</strong>nual <strong>Electric</strong> Generator Report<br />
� Utility” and Form <strong>EIA</strong>-860B, “<strong>An</strong>nual <strong>Electric</strong> Generator<br />
Report � Nonutility.”


