

The Changing Structure of the Electric Power Industry 2000: An ... - EIA
The Changing Structure of the Electric Power Industry 2000: An ... - EIA
The Changing Structure of the Electric Power Industry 2000: An ... - EIA

You also want an ePaper? Increase the reach of your titles
YUMPU automatically turns print PDFs into web optimized ePapers that Google loves.
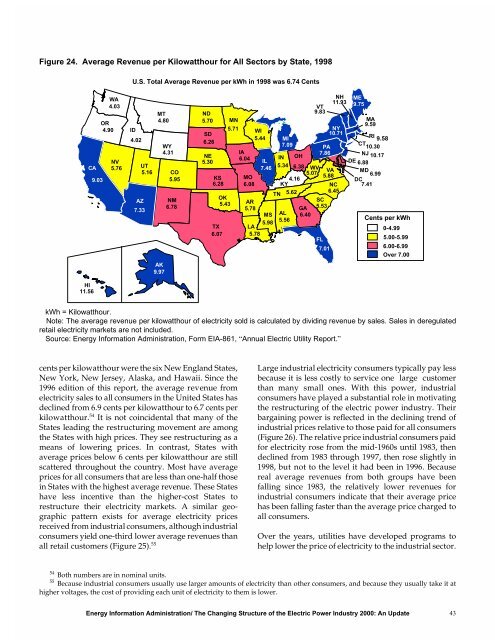
Figure 24. Average Revenue per Kilowatthour for All Sectors by State, 1998<br />
CA<br />
HI<br />
11.56<br />
9.03<br />
WA<br />
4.03<br />
OR<br />
4.90<br />
NV<br />
5.76<br />
U.S. Total Average Revenue per kWh in 1998 was 6.74 Cents<br />
ID<br />
4.02<br />
UT<br />
5.16<br />
AZ<br />
7.33<br />
MT<br />
4.80<br />
AK<br />
9.97<br />
WY<br />
4.31<br />
CO<br />
5.95<br />
NM<br />
6.78<br />
ND<br />
5.70<br />
SD<br />
6.26<br />
NE<br />
5.30<br />
KS<br />
6.28<br />
MN<br />
5.71 WI<br />
5.44<br />
IA<br />
6.04<br />
MO<br />
6.08<br />
11.93<br />
9.83<br />
MA<br />
9.59<br />
10.30<br />
IN OH<br />
10.17<br />
6.88<br />
5.34 6.38 WV<br />
VA<br />
5.07<br />
5.88<br />
6.99<br />
4.16<br />
KY<br />
OK<br />
5.43<br />
TX<br />
AR<br />
5.78<br />
LA<br />
5.62<br />
MS 6.40<br />
5.98<br />
5.56<br />
6.45<br />
5.53<br />
6.07 5.78<br />
FL<br />
7.01<br />
AL<br />
IL<br />
7.46<br />
NH ME<br />
VT<br />
9.75<br />
NY<br />
10.71<br />
MI<br />
RI<br />
9.58<br />
7.09<br />
CT<br />
PA<br />
7.86<br />
NJ<br />
DE<br />
MD<br />
DC<br />
NC 7.41<br />
TN<br />
GA<br />
SC<br />
Cents per kWh<br />
0-4.99<br />
5.00-5.99<br />
6.00-6.99<br />
Over 7.00<br />
kWh = Kilowatthour.<br />
Note: <strong>The</strong> average revenue per kilowatthour <strong>of</strong> electricity sold is calculated by dividing revenue by sales. Sales in deregulated<br />
retail electricity markets are not included.<br />
Source: Energy Information Administration, Form <strong>EIA</strong>-861, “<strong>An</strong>nual <strong>Electric</strong> Utility Report.”<br />
cents per kilowatthour were <strong>the</strong> six New England States,<br />
New York, New Jersey, Alaska, and Hawaii. Since <strong>the</strong><br />
1996 edition <strong>of</strong> this report, <strong>the</strong> average revenue from<br />
electricity sales to all consumers in <strong>the</strong> United States has<br />
declined from 6.9 cents per kilowatthour to 6.7 cents per<br />
kilowatthour. 54 It is not coincidental that many <strong>of</strong> <strong>the</strong><br />
States leading <strong>the</strong> restructuring movement are among<br />
<strong>the</strong> States with high prices. <strong>The</strong>y see restructuring as a<br />
means <strong>of</strong> lowering prices. In contrast, States with<br />
average prices below 6 cents per kilowatthour are still<br />
scattered throughout <strong>the</strong> country. Most have average<br />
prices for all consumers that are less than one-half those<br />
in States with <strong>the</strong> highest average revenue. <strong>The</strong>se States<br />
have less incentive than <strong>the</strong> higher-cost States to<br />
restructure <strong>the</strong>ir electricity markets. A similar geographic<br />
pattern exists for average electricity prices<br />
received from industrial consumers, although industrial<br />
consumers yield one-third lower average revenues than<br />
all retail customers (Figure 25). 55<br />
Large industrial electricity consumers typically pay less<br />
because it is less costly to service one large customer<br />
than many small ones. With this power, industrial<br />
consumers have played a substantial role in motivating<br />
<strong>the</strong> restructuring <strong>of</strong> <strong>the</strong> electric power industry. <strong>The</strong>ir<br />
bargaining power is reflected in <strong>the</strong> declining trend <strong>of</strong><br />
industrial prices relative to those paid for all consumers<br />
(Figure 26). <strong>The</strong> relative price industrial consumers paid<br />
for electricity rose from <strong>the</strong> mid-1960s until 1983, <strong>the</strong>n<br />
declined from 1983 through 1997, <strong>the</strong>n rose slightly in<br />
1998, but not to <strong>the</strong> level it had been in 1996. Because<br />
real average revenues from both groups have been<br />
falling since 1983, <strong>the</strong> relatively lower revenues for<br />
industrial consumers indicate that <strong>the</strong>ir average price<br />
has been falling faster than <strong>the</strong> average price charged to<br />
all consumers.<br />
Over <strong>the</strong> years, utilities have developed programs to<br />
help lower <strong>the</strong> price <strong>of</strong> electricity to <strong>the</strong> industrial sector.<br />
54 Both numbers are in nominal units.<br />
55 Because industrial consumers usually use larger amounts <strong>of</strong> electricity than o<strong>the</strong>r consumers, and because <strong>the</strong>y usually take it at<br />
higher voltages, <strong>the</strong> cost <strong>of</strong> providing each unit <strong>of</strong> electricity to <strong>the</strong>m is lower.<br />
Energy Information Administration/ <strong>The</strong> <strong>Changing</strong> <strong>Structure</strong> <strong>of</strong> <strong>the</strong> <strong>Electric</strong> <strong>Power</strong> <strong>Industry</strong> <strong>2000</strong>: <strong>An</strong> Update 43


