

The Changing Structure of the Electric Power Industry 2000: An ... - EIA
The Changing Structure of the Electric Power Industry 2000: An ... - EIA
The Changing Structure of the Electric Power Industry 2000: An ... - EIA

Create successful ePaper yourself
Turn your PDF publications into a flip-book with our unique Google optimized e-Paper software.
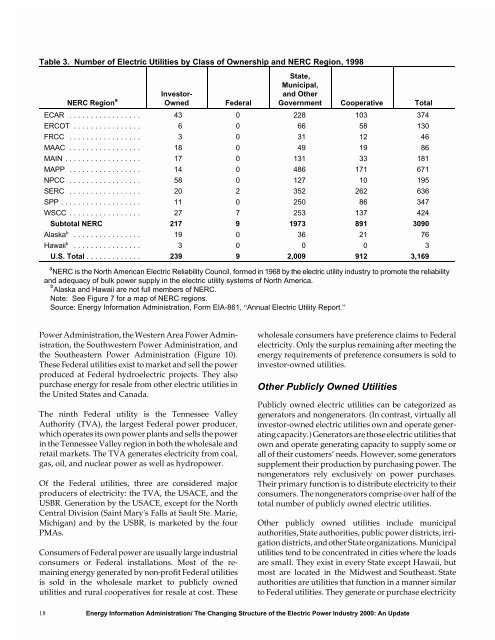
Table 3. Number <strong>of</strong> <strong>Electric</strong> Utilities by Class <strong>of</strong> Ownership and NERC Region, 1998<br />
NERC Region a<br />
Investor-<br />
Owned Federal<br />
State,<br />
Municipal,<br />
and O<strong>the</strong>r<br />
Government Cooperative Total<br />
ECAR ................. 43 0 228 103 374<br />
ERCOT ................ 6 0 66 58 130<br />
FRCC ................. 3 0 31 12 46<br />
MAAC ................. 18 0 49 19 86<br />
MAIN .................. 17 0 131 33 181<br />
MAPP ................. 14 0 486 171 671<br />
NPCC ................. 58 0 127 10 195<br />
SERC ................. 20 2 352 262 636<br />
SPP................... 11 0 250 86 347<br />
WSCC ................. 27 7 253 137 424<br />
Subtotal NERC 217 9 1973 891 3090<br />
Alaskab ................ 19 0 36 21 76<br />
Hawaiib ................ 3 0 0 0 3<br />
U.S. Total ............. 239 9 2,009 912 3,169<br />
a NERC is <strong>the</strong> North American <strong>Electric</strong> Reliability Council, formed in 1968 by <strong>the</strong> electric utility industry to promote <strong>the</strong> reliability<br />
and adequacy <strong>of</strong> bulk power supply in <strong>the</strong> electric utility systems <strong>of</strong> North America.<br />
b Alaska and Hawaii are not full members <strong>of</strong> NERC.<br />
Note: See Figure 7 for a map <strong>of</strong> NERC regions.<br />
Source: Energy Information Administration, Form <strong>EIA</strong>-861, “<strong>An</strong>nual <strong>Electric</strong> Utility Report.”<br />
<strong>Power</strong> Administration, <strong>the</strong> Western Area <strong>Power</strong> Administration,<br />
<strong>the</strong> Southwestern <strong>Power</strong> Administration, and<br />
<strong>the</strong> Sou<strong>the</strong>astern <strong>Power</strong> Administration (Figure 10).<br />
<strong>The</strong>se Federal utilities exist to market and sell <strong>the</strong> power<br />
produced at Federal hydroelectric projects. <strong>The</strong>y also<br />
purchase energy for resale from o<strong>the</strong>r electric utilities in<br />
<strong>the</strong> United States and Canada.<br />
<strong>The</strong> ninth Federal utility is <strong>the</strong> Tennessee Valley<br />
Authority (TVA), <strong>the</strong> largest Federal power producer,<br />
which operates its own power plants and sells <strong>the</strong> power<br />
in <strong>the</strong> Tennessee Valley region in both <strong>the</strong> wholesale and<br />
retail markets. <strong>The</strong> TVA generates electricity from coal,<br />
gas, oil, and nuclear power as well as hydropower.<br />
Of <strong>the</strong> Federal utilities, three are considered major<br />
producers <strong>of</strong> electricity: <strong>the</strong> TVA, <strong>the</strong> USACE, and <strong>the</strong><br />
USBR. Generation by <strong>the</strong> USACE, except for <strong>the</strong> North<br />
Central Division (Saint Mary's Falls at Sault Ste. Marie,<br />
Michigan) and by <strong>the</strong> USBR, is marketed by <strong>the</strong> four<br />
PMAs.<br />
Consumers <strong>of</strong> Federal power are usually large industrial<br />
consumers or Federal installations. Most <strong>of</strong> <strong>the</strong> remaining<br />
energy generated by non-pr<strong>of</strong>it Federal utilities<br />
is sold in <strong>the</strong> wholesale market to publicly owned<br />
utilities and rural cooperatives for resale at cost. <strong>The</strong>se<br />
18<br />
wholesale consumers have preference claims to Federal<br />
electricity. Only <strong>the</strong> surplus remaining after meeting <strong>the</strong><br />
energy requirements <strong>of</strong> preference consumers is sold to<br />
investor-owned utilities.<br />
O<strong>the</strong>r Publicly Owned Utilities<br />
Publicly owned electric utilities can be categorized as<br />
generators and nongenerators. (In contrast, virtually all<br />
investor-owned electric utilities own and operate generating<br />
capacity.) Generators are those electric utilities that<br />
own and operate generating capacity to supply some or<br />
all <strong>of</strong> <strong>the</strong>ir customers’ needs. However, some generators<br />
supplement <strong>the</strong>ir production by purchasing power. <strong>The</strong><br />
nongenerators rely exclusively on power purchases.<br />
<strong>The</strong>ir primary function is to distribute electricity to <strong>the</strong>ir<br />
consumers. <strong>The</strong> nongenerators comprise over half <strong>of</strong> <strong>the</strong><br />
total number <strong>of</strong> publicly owned electric utilities.<br />
O<strong>the</strong>r publicly owned utilities include municipal<br />
authorities, State authorities, public power districts, irrigation<br />
districts, and o<strong>the</strong>r State organizations. Municipal<br />
utilities tend to be concentrated in cities where <strong>the</strong> loads<br />
are small. <strong>The</strong>y exist in every State except Hawaii, but<br />
most are located in <strong>the</strong> Midwest and Sou<strong>the</strong>ast. State<br />
authorities are utilities that function in a manner similar<br />
to Federal utilities. <strong>The</strong>y generate or purchase electricity<br />
Energy Information Administration/ <strong>The</strong> <strong>Changing</strong> <strong>Structure</strong> <strong>of</strong> <strong>the</strong> <strong>Electric</strong> <strong>Power</strong> <strong>Industry</strong> <strong>2000</strong>: <strong>An</strong> Update


