TH`ESE Docteur de l'Université Paris-Dauphine Morgan HERVÉ ...
TH`ESE Docteur de l'Université Paris-Dauphine Morgan HERVÉ ...
TH`ESE Docteur de l'Université Paris-Dauphine Morgan HERVÉ ...

You also want an ePaper? Increase the reach of your titles
YUMPU automatically turns print PDFs into web optimized ePapers that Google loves.
We observe that the carbon allowance price respon<strong>de</strong>d to the typical market<br />
fundamentals that were valid during phase I. In addition to this, the<br />
price of EUAs was evi<strong>de</strong>ntly influenced by any major announcement related<br />
to phase II emissions cap (NAP submissions, reviews, validations and legal<br />
challenges notably) and intertemporal flexibility with phase III of the<br />
scheme. Secondary CER tra<strong>de</strong>d at a discount to EUAs. The price differential<br />
between the two compliance assets reflects the limitations imposed<br />
on the use of this flexibility mechanism for EU ETS compliance buyers and<br />
some opportunistic tra<strong>de</strong>s on the part of the largest players on the market<br />
(Mansanet-Bataller et al., 2011 [12]).<br />
350<br />
300<br />
250<br />
200<br />
150<br />
100<br />
50<br />
0<br />
352.8<br />
18%<br />
200<br />
9%<br />
85<br />
8%<br />
Total Germany United<br />
Kingdom<br />
31.5<br />
Total expected<br />
17 13.5<br />
2.6<br />
0.19%<br />
Auctioned until may 11, 2009 (%)<br />
2 0.5 0.5<br />
France Netherlands Hungary Ireland Austria Belgium Denmark<br />
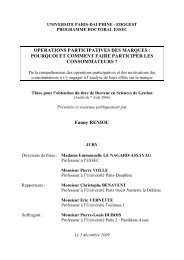
Figure 1.3: Volume of allowance auctioning during Phase II in Mt - from<br />
Caisse <strong>de</strong>s Dépôts Tendances Carbone 36<br />
Phase II was also marked by a larger proportion of auctioning of allowances<br />
than in phase I. Figure 1.3, reproduced from Tendances Carbone no. 36 and<br />
based on EC data, illustrates this ten<strong>de</strong>ncy. This increased the overall constraint<br />
as a larger proportion of allowances was to be acquired rather than<br />
allocated for free. This generated extra revenues for members states organising<br />
auctions. In addition to this, the level of the new entrants reserves is<br />
varying between member states <strong>de</strong>pending on member states and ultimately<br />
on additional installations that would be inclu<strong>de</strong>d in the scope of the EU<br />
ETS during the course of phase II. Finally, in phase II, new parameters<br />
in draft and revised NAP were introduced: benchmarking system for the<br />
energy sector in the revised German NAP for phase II, etc. Table 1.4 summarises<br />
the key data on phase II NAPs as of early 2010 (based on CDC<br />
Climat Research, EC and NAP) 10 .<br />
10 *ThereisnonewentrantsreserveintheNorwegianNAP.**The12Icelandicinstallations<br />
falling within the scope of the Directive have been exclu<strong>de</strong>d as they are already<br />
subject to more constraining emissions reduction measures.<br />
16