c - IARIA Journals
c - IARIA Journals
c - IARIA Journals

Create successful ePaper yourself
Turn your PDF publications into a flip-book with our unique Google optimized e-Paper software.
International Journal on Advances in Systems and Measurements, vol 5 no 3 & 4, year 2012, http://www.iariajournals.org/systems_and_measurements/<br />
Figure 4. Object test set-up.<br />
In the proposed system, pulsed excitation is applied to the<br />
coil. Pulsed excitation provides the opportunity to apply an<br />
interrogating field with rich frequency components in a single<br />
waveform. In the tests detailed in this paper, a pulse repetition<br />
frequency of 500Hz was used with a pulse width of 1ms and an<br />
applied current of 0.5A – 1.5A.<br />
III. SYSTEM EFFICIENCY AND TEST VALIDITY<br />
This section explains different experimental setups used<br />
during tests to improve the ability and efficiency of the detection<br />
system. Also, repeatability is examined to check the validity and<br />
to confirm the measurements.<br />
A. Different orientation experimental setups<br />
To check validity of the proposed system, experiments were<br />
carried out to study the reflected signals from objects under<br />
different orientations.<br />
Figure 6 shows the test set-up for different orientations. The<br />
objects were moved past the array dynamically and data were<br />
taken while the object was moving. Data were taken with the<br />
samples orientated in three directions.<br />
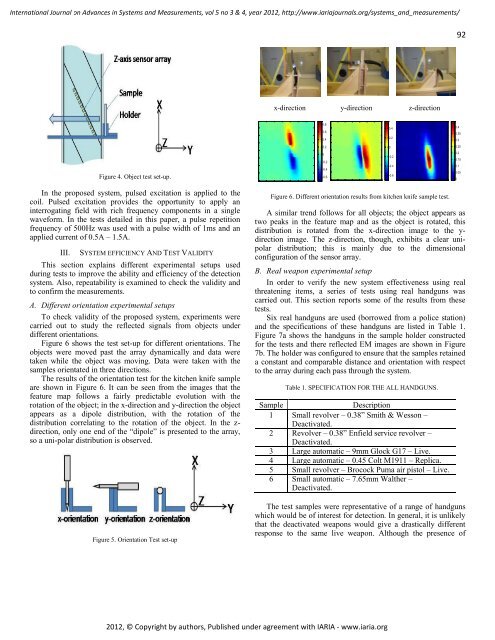
The results of the orientation test for the kitchen knife sample<br />
are shown in Figure 6. It can be seen from the images that the<br />
feature map follows a fairly predictable evolution with the<br />
rotation of the object; in the x-direction and y-direction the object<br />
appears as a dipole distribution, with the rotation of the<br />
distribution correlating to the rotation of the object. In the zdirection,<br />
only one end of the “dipole” is presented to the array,<br />
so a uni-polar distribution is observed.<br />
Figure 5. Orientation Test set-up<br />
x-direction y-direction z-direction<br />
20 40 60 80 100 120 140<br />
Figure 6. Different orientation results from kitchen knife sample test.<br />
2012, © Copyright by authors, Published under agreement with <strong>IARIA</strong> - www.iaria.org<br />
5<br />
10<br />
15<br />
20<br />
25<br />
30<br />
35<br />
40<br />
0.8<br />
5<br />
0.6<br />
10<br />
0.4<br />
15<br />
0.2<br />
20<br />
0<br />
25<br />
-0.2<br />
30<br />
-0.4<br />
35<br />
-0.6<br />
40<br />
20 40 60 80 100 120 140<br />
92<br />
35<br />
-0.6<br />
0.05<br />
40 0<br />
20 40 60 80 100 120 140<br />
A similar trend follows for all objects; the object appears as<br />
two peaks in the feature map and as the object is rotated, this<br />
distribution is rotated from the x-direction image to the ydirection<br />
image. The z-direction, though, exhibits a clear unipolar<br />
distribution; this is mainly due to the dimensional<br />
configuration of the sensor array.<br />
B. Real weapon experimental setup<br />
In order to verify the new system effectiveness using real<br />
threatening items, a series of tests using real handguns was<br />
carried out. This section reports some of the results from these<br />
tests.<br />
Six real handguns are used (borrowed from a police station)<br />
and the specifications of these handguns are listed in Table 1.<br />
Figure 7a shows the handguns in the sample holder constructed<br />
for the tests and there reflected EM images are shown in Figure<br />
7b. The holder was configured to ensure that the samples retained<br />
a constant and comparable distance and orientation with respect<br />
to the array during each pass through the system.<br />
Table 1. SPECIFICATION FOR THE ALL HANDGUNS.<br />
Sample Description<br />
1 Small revolver – 0.38” Smith & Wesson –<br />
Deactivated.<br />
2 Revolver – 0.38” Enfield service revolver –<br />
Deactivated.<br />
3 Large automatic – 9mm Glock G17 – Live.<br />
4 Large automatic – 0.45 Colt M1911 – Replica.<br />
5 Small revolver – Brocock Puma air pistol – Live.<br />
6 Small automatic – 7.65mm Walther –<br />
Deactivated.<br />
The test samples were representative of a range of handguns<br />
which would be of interest for detection. In general, it is unlikely<br />
that the deactivated weapons would give a drastically different<br />
response to the same live weapon. Although the presence of<br />
0.4 5<br />
10<br />
0.2<br />
15<br />
0<br />
20<br />
-0.2 25<br />
30<br />
-0.4<br />
0.4<br />
0.35<br />
0.3<br />
0.25<br />
0.2<br />
0.15<br />
0.1