c - IARIA Journals
c - IARIA Journals
c - IARIA Journals

Create successful ePaper yourself
Turn your PDF publications into a flip-book with our unique Google optimized e-Paper software.
International Journal on Advances in Systems and Measurements, vol 5 no 3 & 4, year 2012, http://www.iariajournals.org/systems_and_measurements/<br />
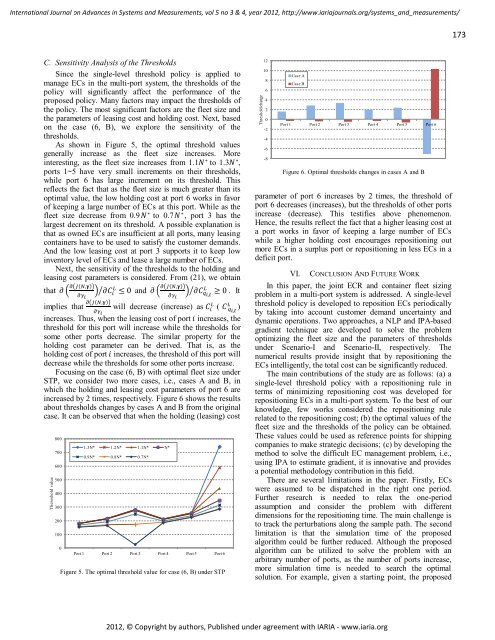
C. Sensitivity Analysis of the Thresholds<br />
Since the single-level threshold policy is applied to<br />
manage ECs in the multi-port system, the thresholds of the<br />
policy will significantly affect the performance of the<br />
proposed policy. Many factors may impact the thresholds of<br />
the policy. The most significant factors are the fleet size and<br />
the parameters of leasing cost and holding cost. Next, based<br />
on the case (6, B), we explore the sensitivity of the<br />
thresholds.<br />
As shown in Figure 5, the optimal threshold values<br />
generally increase as the fleet size increases. More<br />
interesting, as the fleet size increases from 1.1 to 1.3 ,<br />
ports 1~5 have very small increments on their thresholds,<br />
while port 6 has large increment on its threshold. This<br />
reflects the fact that as the fleet size is much greater than its<br />
optimal value, the low holding cost at port 6 works in favor<br />
of keeping a large number of ECs at this port. While as the<br />
fleet size decrease from 0.9 to 0.7 , port 3 has the<br />
largest decrement on its threshold. A possible explanation is<br />
that as owned ECs are insufficient at all ports, many leasing<br />
containers have to be used to satisfy the customer demands.<br />
And the low leasing cost at port 3 supports it to keep low<br />
inventory level of ECs and lease a large number of ECs.<br />
Next, the sensitivity of the thresholds to the holding and<br />
leasing cost parameters is considered. From (21), we obtain<br />
that<br />
implies that<br />
and<br />
will decrease (increase) as (<br />
. It<br />
increases. Thus, when the leasing cost of port increases, the<br />
threshold for this port will increase while the thresholds for<br />
some other ports decrease. The similar property for the<br />
holding cost parameter can be derived. That is, as the<br />
holding cost of port increases, the threshold of this port will<br />
decrease while the thresholds for some other ports increase.<br />
Focusing on the case (6, B) with optimal fleet size under<br />
STP, we consider two more cases, i.e., cases A and B, in<br />
which the holding and leasing cost parameters of port 6 are<br />
increased by 2 times, respectively. Figure 6 shows the results<br />
about thresholds changes by cases A and B from the original<br />
case. It can be observed that when the holding (leasing) cost<br />
Thereshold value<br />
800<br />
700<br />
600<br />
500<br />
400<br />
300<br />
200<br />
100<br />
0<br />
1.3N* 1.2N* 1.1N* N*<br />
0.9N* 0.8N* 0.7N*<br />
Port 1 Port 2 Port 3 Port 4 Port 5 Port 6<br />
Figure 5. The optimal threshold value for case (6, B) under STP<br />
)<br />
parameter of port 6 increases by 2 times, the threshold of<br />
port 6 decreases (increases), but the thresholds of other ports<br />
increase (decrease). This testifies above phenomenon.<br />
Hence, the results reflect the fact that a higher leasing cost at<br />
a port works in favor of keeping a large number of ECs<br />
while a higher holding cost encourages repositioning out<br />
more ECs in a surplus port or repositioning in less ECs in a<br />
deficit port.<br />
VI. CONCLUSION AND FUTURE WORK<br />
In this paper, the joint ECR and container fleet sizing<br />
problem in a multi-port system is addressed. A single-level<br />
threshold policy is developed to reposition ECs periodically<br />
by taking into account customer demand uncertainty and<br />
dynamic operations. Two approaches, a NLP and IPA-based<br />
gradient technique are developed to solve the problem<br />
optimizing the fleet size and the parameters of thresholds<br />
under Scenario-I and Scenario-II, respectively. The<br />
numerical results provide insight that by repositioning the<br />
ECs intelligently, the total cost can be significantly reduced.<br />
The main contributions of the study are as follows: (a) a<br />
single-level threshold policy with a repositioning rule in<br />
terms of minimizing repositioning cost was developed for<br />
repositioning ECs in a multi-port system. To the best of our<br />
knowledge, few works considered the repositioning rule<br />
related to the repositioning cost; (b) the optimal values of the<br />
fleet size and the thresholds of the policy can be obtained.<br />
These values could be used as reference points for shipping<br />
companies to make strategic decisions; (c) by developing the<br />
method to solve the difficult EC management problem, i.e.,<br />
using IPA to estimate gradient, it is innovative and provides<br />
a potential methodology contribution in this field.<br />
There are several limitations in the paper. Firstly, ECs<br />
were assumed to be dispatched in the right one period.<br />
Further research is needed to relax the one-period<br />
assumption and consider the problem with different<br />
dimensions for the repositioning time. The main challenge is<br />
to track the perturbations along the sample path. The second<br />
limitation is that the simulation time of the proposed<br />
algorithm could be further reduced. Although the proposed<br />
algorithm can be utilized to solve the problem with an<br />
arbitrary number of ports, as the number of ports increase,<br />
more simulation time is needed to search the optimal<br />
solution. For example, given a starting point, the proposed<br />
2012, © Copyright by authors, Published under agreement with <strong>IARIA</strong> - www.iaria.org<br />
Threshold change<br />
12<br />
10<br />
8<br />
6<br />
4<br />
2<br />
0<br />
-2<br />
-4<br />
-6<br />
-8<br />
Case A<br />
Case B<br />
Port 1 Port 2 Port 3 Port 4 Port 5 Port 6<br />
Figure 6. Optimal thresholds changes in cases A and B<br />
173