c - IARIA Journals
c - IARIA Journals
c - IARIA Journals

Create successful ePaper yourself
Turn your PDF publications into a flip-book with our unique Google optimized e-Paper software.
International Journal on Advances in Systems and Measurements, vol 5 no 3 & 4, year 2012, http://www.iariajournals.org/systems_and_measurements/<br />
1<br />
0.8<br />
0.6<br />
0.4<br />
0.2<br />
0<br />
0 0.1 0.2 0.3 0.4 0.5 0.6 0.7 0.8 0.9 1<br />
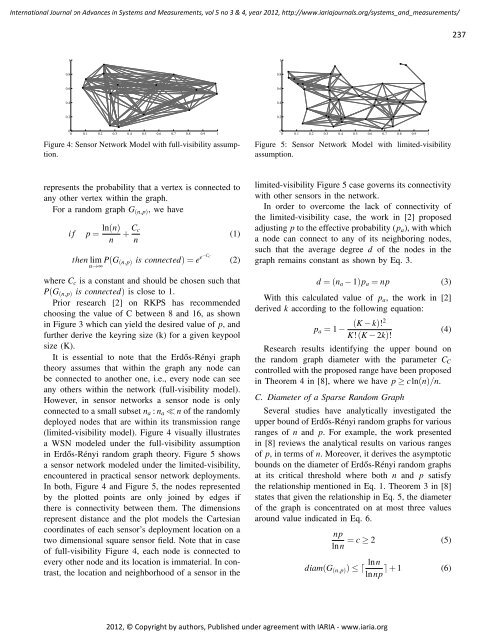
Figure 4: Sensor Network Model with full-visibility assumption.<br />
represents the probability that a vertex is connected to<br />
any other vertex within the graph.<br />
For a random graph G(n,p), we have<br />
i f p = ln(n)<br />
n<br />
+ Cc<br />
n<br />
then lim<br />
n→∞ P(G(n,p) is connected) = e e−Cc<br />
(1)<br />
(2)<br />
where Cc is a constant and should be chosen such that<br />
P(G(n,p) is connected) is close to 1.<br />
Prior research [2] on RKPS has recommended<br />
choosing the value of C between 8 and 16, as shown<br />
in Figure 3 which can yield the desired value of p, and<br />
further derive the keyring size (k) for a given keypool<br />
size (K).<br />
It is essential to note that the Erdős-Rényi graph<br />
theory assumes that within the graph any node can<br />
be connected to another one, i.e., every node can see<br />
any others within the network (full-visibility model).<br />
However, in sensor networks a sensor node is only<br />
connected to a small subset na : na ≪ n of the randomly<br />
deployed nodes that are within its transmission range<br />
(limited-visibility model). Figure 4 visually illustrates<br />
a WSN modeled under the full-visibility assumption<br />
in Erdős-Rényi random graph theory. Figure 5 shows<br />
a sensor network modeled under the limited-visibility,<br />
encountered in practical sensor network deployments.<br />
In both, Figure 4 and Figure 5, the nodes represented<br />
by the plotted points are only joined by edges if<br />
there is connectivity between them. The dimensions<br />
represent distance and the plot models the Cartesian<br />
coordinates of each sensor’s deployment location on a<br />
two dimensional square sensor field. Note that in case<br />
of full-visibility Figure 4, each node is connected to<br />
every other node and its location is immaterial. In contrast,<br />
the location and neighborhood of a sensor in the<br />
2012, © Copyright by authors, Published under agreement with <strong>IARIA</strong> - www.iaria.org<br />
1<br />
0.8<br />
0.6<br />
0.4<br />
0.2<br />
0<br />
0 0.1 0.2 0.3 0.4 0.5 0.6 0.7 0.8 0.9 1<br />
Figure 5: Sensor Network Model with limited-visibility<br />
assumption.<br />
limited-visibility Figure 5 case governs its connectivity<br />
with other sensors in the network.<br />
In order to overcome the lack of connectivity of<br />
the limited-visibility case, the work in [2] proposed<br />
adjusting p to the effective probability (pa), with which<br />
a node can connect to any of its neighboring nodes,<br />
such that the average degree d of the nodes in the<br />
graph remains constant as shown by Eq. 3.<br />
d = (na − 1)pa = np (3)<br />
With this calculated value of pa, the work in [2]<br />
derived k according to the following equation:<br />
pa = 1 −<br />
(K − k)!2<br />
K!(K − 2k)!<br />
(4)<br />
Research results identifying the upper bound on<br />
the random graph diameter with the parameter CC<br />
controlled with the proposed range have been proposed<br />
in Theorem 4 in [8], where we have p ≥ cln(n)/n.<br />
C. Diameter of a Sparse Random Graph<br />
Several studies have analytically investigated the<br />
upper bound of Erdős-Rényi random graphs for various<br />
ranges of n and p. For example, the work presented<br />
in [8] reviews the analytical results on various ranges<br />
of p, in terms of n. Moreover, it derives the asymptotic<br />
bounds on the diameter of Erdős-Rényi random graphs<br />
at its critical threshold where both n and p satisfy<br />
the relationship mentioned in Eq. 1. Theorem 3 in [8]<br />
states that given the relationship in Eq. 5, the diameter<br />
of the graph is concentrated on at most three values<br />
around value indicated in Eq. 6.<br />
np<br />
= c ≥ 2 (5)<br />
lnn<br />
diam(G(n,p)) ≤ ⌈ lnn<br />
⌉ + 1 (6)<br />
lnnp<br />
237