c - IARIA Journals
c - IARIA Journals
c - IARIA Journals

Create successful ePaper yourself
Turn your PDF publications into a flip-book with our unique Google optimized e-Paper software.
International Journal on Advances in Systems and Measurements, vol 5 no 3 & 4, year 2012, http://www.iariajournals.org/systems_and_measurements/<br />
1<br />
0.5<br />
0<br />
−0.5<br />
−1<br />
1<br />
0.5<br />
0<br />
−0.5<br />
−1<br />
−1<br />
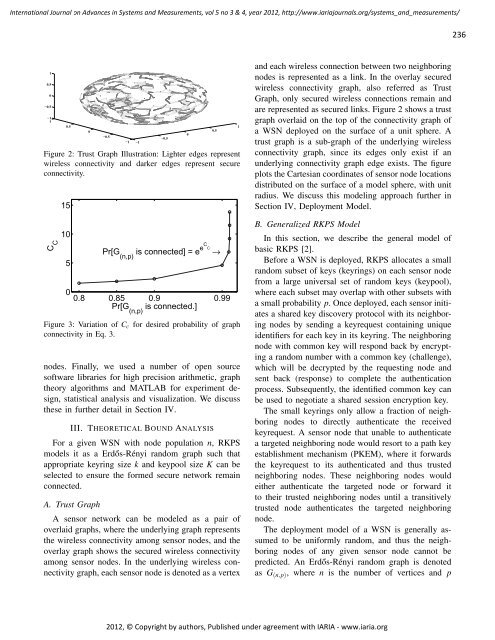
Figure 2: Trust Graph Illustration: Lighter edges represent<br />
wireless connectivity and darker edges represent secure<br />
connectivity.<br />
C C<br />
15<br />
10<br />
5<br />
0<br />
0.8 0.85 0.9 0.99<br />
Pr[G is connected.]<br />
(n,p)<br />
−0.5<br />
Pr[G is connected] = e<br />
(n,p) eCC →<br />
Figure 3: Variation of Cc for desired probability of graph<br />
connectivity in Eq. 3.<br />
nodes. Finally, we used a number of open source<br />
software libraries for high precision arithmetic, graph<br />
theory algorithms and MATLAB for experiment design,<br />
statistical analysis and visualization. We discuss<br />
these in further detail in Section IV.<br />
III. THEORETICAL BOUND ANALYSIS<br />
For a given WSN with node population n, RKPS<br />
models it as a Erdős-Rényi random graph such that<br />
appropriate keyring size k and keypool size K can be<br />
selected to ensure the formed secure network remain<br />
connected.<br />
A. Trust Graph<br />
A sensor network can be modeled as a pair of<br />
overlaid graphs, where the underlying graph represents<br />
the wireless connectivity among sensor nodes, and the<br />
overlay graph shows the secured wireless connectivity<br />
among sensor nodes. In the underlying wireless connectivity<br />
graph, each sensor node is denoted as a vertex<br />
0<br />
0.5<br />
1<br />
and each wireless connection between two neighboring<br />
nodes is represented as a link. In the overlay secured<br />
wireless connectivity graph, also referred as Trust<br />
Graph, only secured wireless connections remain and<br />
are represented as secured links. Figure 2 shows a trust<br />
graph overlaid on the top of the connectivity graph of<br />
a WSN deployed on the surface of a unit sphere. A<br />
trust graph is a sub-graph of the underlying wireless<br />
connectivity graph, since its edges only exist if an<br />
underlying connectivity graph edge exists. The figure<br />
plots the Cartesian coordinates of sensor node locations<br />
distributed on the surface of a model sphere, with unit<br />
radius. We discuss this modeling approach further in<br />
Section IV, Deployment Model.<br />
B. Generalized RKPS Model<br />
In this section, we describe the general model of<br />
basic RKPS [2].<br />
Before a WSN is deployed, RKPS allocates a small<br />
random subset of keys (keyrings) on each sensor node<br />
from a large universal set of random keys (keypool),<br />
where each subset may overlap with other subsets with<br />
a small probability p. Once deployed, each sensor initiates<br />
a shared key discovery protocol with its neighboring<br />
nodes by sending a keyrequest containing unique<br />
identifiers for each key in its keyring. The neighboring<br />
node with common key will respond back by encrypting<br />
a random number with a common key (challenge),<br />
which will be decrypted by the requesting node and<br />
sent back (response) to complete the authentication<br />
process. Subsequently, the identified common key can<br />
be used to negotiate a shared session encryption key.<br />
The small keyrings only allow a fraction of neighboring<br />
nodes to directly authenticate the received<br />
keyrequest. A sensor node that unable to authenticate<br />
a targeted neighboring node would resort to a path key<br />
establishment mechanism (PKEM), where it forwards<br />
the keyrequest to its authenticated and thus trusted<br />
neighboring nodes. These neighboring nodes would<br />
either authenticate the targeted node or forward it<br />
to their trusted neighboring nodes until a transitively<br />
trusted node authenticates the targeted neighboring<br />
node.<br />
The deployment model of a WSN is generally assumed<br />
to be uniformly random, and thus the neighboring<br />
nodes of any given sensor node cannot be<br />
predicted. An Erdős-Rényi random graph is denoted<br />
as G(n,p), where n is the number of vertices and p<br />
2012, © Copyright by authors, Published under agreement with <strong>IARIA</strong> - www.iaria.org<br />
236