c - IARIA Journals
c - IARIA Journals
c - IARIA Journals

You also want an ePaper? Increase the reach of your titles
YUMPU automatically turns print PDFs into web optimized ePapers that Google loves.
International Journal on Advances in Systems and Measurements, vol 5 no 3 & 4, year 2012, http://www.iariajournals.org/systems_and_measurements/<br />
Figure 9 shows the EM images for the controlled and walkthrough<br />
tests using the handgun sample #3. The results from the<br />
walk-through test have been expanded along the horizontal axis<br />
compared to Figure 8b to aid comparison. Comparison of the<br />
plots shows that although the controlled and walk-through tests<br />
did not give identical results, the general form of the EM<br />
signatures was roughly similar. Thus, using appropriate analysis<br />
techniques it can be ascertained that the signatures are from<br />
similar, if not the same object.<br />
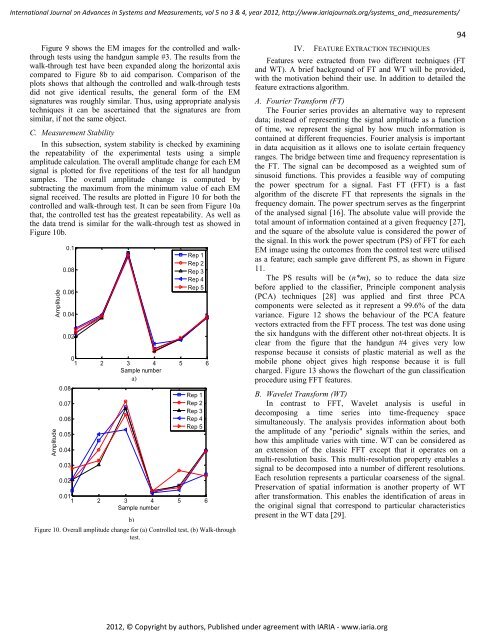
C. Measurement Stability<br />
In this subsection, system stability is checked by examining<br />
the repeatability of the experimental tests using a simple<br />
amplitude calculation. The overall amplitude change for each EM<br />
signal is plotted for five repetitions of the test for all handgun<br />
samples. The overall amplitude change is computed by<br />
subtracting the maximum from the minimum value of each EM<br />
signal received. The results are plotted in Figure 10 for both the<br />
controlled and walk-through test. It can be seen from Figure 10a<br />
that, the controlled test has the greatest repeatability. As well as<br />
the data trend is similar for the walk-through test as showed in<br />
Figure 10b.<br />
Amplitude<br />
Amplitude<br />
0.1<br />
0.08<br />
0.06<br />
0.04<br />
0.02<br />
0.08<br />
0.07<br />
0.06<br />
0.05<br />
0.04<br />
0.03<br />
0.02<br />
REPEATABILITY - CONTROLLED TEST<br />
Rep 1<br />
Rep 2<br />
Rep 3<br />
Rep 4<br />
Rep 5<br />
0<br />
1 2 3 4 5 6<br />
Sample number<br />
REPEATABILITY - WALK-THRU,<br />
a)<br />
FULL ARRAY<br />
0.01<br />
1 2 3 4 5 6<br />
Sample number<br />
b)<br />
Rep 1<br />
Rep 2<br />
Rep 3<br />
Rep 4<br />
Rep 5<br />
Figure 10. Overall amplitude change for (a) Controlled test, (b) Walk-through<br />
test.<br />
IV. FEATURE EXTRACTION TECHNIQUES<br />
2012, © Copyright by authors, Published under agreement with <strong>IARIA</strong> - www.iaria.org<br />
94<br />
Features were extracted from two different techniques (FT<br />
and WT). A brief background of FT and WT will be provided,<br />
with the motivation behind their use. In addition to detailed the<br />
feature extractions algorithm.<br />
A. Fourier Transform (FT)<br />
The Fourier series provides an alternative way to represent<br />
data; instead of representing the signal amplitude as a function<br />
of time, we represent the signal by how much information is<br />
contained at different frequencies. Fourier analysis is important<br />
in data acquisition as it allows one to isolate certain frequency<br />
ranges. The bridge between time and frequency representation is<br />
the FT. The signal can be decomposed as a weighted sum of<br />
sinusoid functions. This provides a feasible way of computing<br />
the power spectrum for a signal. Fast FT (FFT) is a fast<br />
algorithm of the discrete FT that represents the signals in the<br />
frequency domain. The power spectrum serves as the fingerprint<br />
of the analysed signal [16]. The absolute value will provide the<br />
total amount of information contained at a given frequency [27],<br />
and the square of the absolute value is considered the power of<br />
the signal. In this work the power spectrum (PS) of FFT for each<br />
EM image using the outcomes from the control test were utilised<br />
as a feature; each sample gave different PS, as shown in Figure<br />
11.<br />
The PS results will be (n*m), so to reduce the data size<br />
before applied to the classifier, Principle component analysis<br />
(PCA) techniques [28] was applied and first three PCA<br />
components were selected as it represent a 99.6% of the data<br />
variance. Figure 12 shows the behaviour of the PCA feature<br />
vectors extracted from the FFT process. The test was done using<br />
the six handguns with the different other not-threat objects. It is<br />
clear from the figure that the handgun #4 gives very low<br />
response because it consists of plastic material as well as the<br />
mobile phone object gives high response because it is full<br />
charged. Figure 13 shows the flowchart of the gun classification<br />
procedure using FFT features.<br />
B. Wavelet Transform (WT)<br />
In contrast to FFT, Wavelet analysis is useful in<br />
decomposing a time series into time-frequency space<br />
simultaneously. The analysis provides information about both<br />
the amplitude of any "periodic" signals within the series, and<br />
how this amplitude varies with time. WT can be considered as<br />
an extension of the classic FFT except that it operates on a<br />
multi-resolution basis. This multi-resolution property enables a<br />
signal to be decomposed into a number of different resolutions.<br />
Each resolution represents a particular coarseness of the signal.<br />
Preservation of spatial information is another property of WT<br />
after transformation. This enables the identification of areas in<br />
the original signal that correspond to particular characteristics<br />
present in the WT data [29].