

BERKSHIRE HATHAWAY
BERKSHIRE HATHAWAY
BERKSHIRE HATHAWAY

Create successful ePaper yourself
Turn your PDF publications into a flip-book with our unique Google optimized e-Paper software.
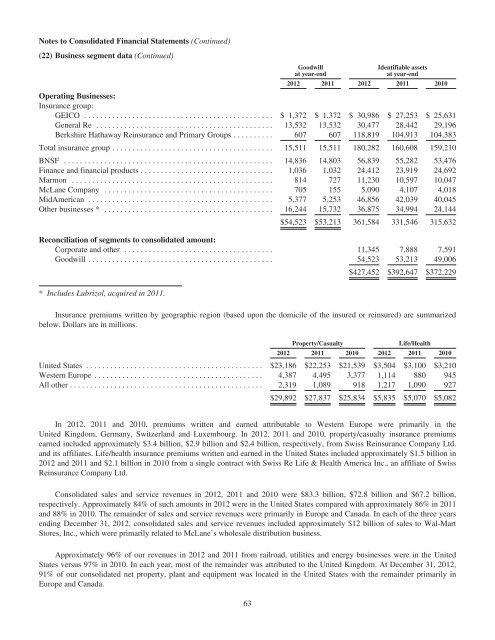
Notes to Consolidated Financial Statements (Continued)<br />
(22) Business segment data (Continued)<br />
Goodwill<br />
at year-end<br />
Identifiable assets<br />
at year-end<br />
2012 2011 2012 2011 2010<br />
Operating Businesses:<br />
Insurance group:<br />
GEICO ............................................... $ 1,372 $ 1,372 $ 30,986 $ 27,253 $ 25,631<br />
General Re ............................................ 13,532 13,532 30,477 28,442 29,196<br />
Berkshire Hathaway Reinsurance and Primary Groups .......... 607 607 118,819 104,913 104,383<br />
Total insurance group ........................................ 15,511 15,511 180,282 160,608 159,210<br />
BNSF .................................................... 14,836 14,803 56,839 55,282 53,476<br />
Finance and financial products ................................. 1,036 1,032 24,412 23,919 24,692<br />
Marmon .................................................. 814 727 11,230 10,597 10,047<br />
McLane Company .......................................... 705 155 5,090 4,107 4,018<br />
MidAmerican .............................................. 5,377 5,253 46,856 42,039 40,045<br />
Other businesses * .......................................... 16,244 15,732 36,875 34,994 24,144<br />
$54,523 $53,213 361,584 331,546 315,632<br />
Reconciliation of segments to consolidated amount:<br />
Corporate and other ..................................... 11,345 7,888 7,591<br />
Goodwill .............................................. 54,523 53,213 49,006<br />
$427,452 $392,647 $372,229<br />
* Includes Lubrizol, acquired in 2011.<br />
Insurance premiums written by geographic region (based upon the domicile of the insured or reinsured) are summarized<br />
below. Dollars are in millions.<br />
Property/Casualty Life/Health<br />
2012 2011 2010 2012 2011 2010<br />
United States ............................................ $23,186 $22,253 $21,539 $3,504 $3,100 $3,210<br />
Western Europe .......................................... 4,387 4,495 3,377 1,114 880 945<br />
All other ................................................ 2,319 1,089 918 1,217 1,090 927<br />
$29,892 $27,837 $25,834 $5,835 $5,070 $5,082<br />
In 2012, 2011 and 2010, premiums written and earned attributable to Western Europe were primarily in the<br />
United Kingdom, Germany, Switzerland and Luxembourg. In 2012, 2011 and 2010, property/casualty insurance premiums<br />
earned included approximately $3.4 billion, $2.9 billion and $2.4 billion, respectively, from Swiss Reinsurance Company Ltd.<br />
and its affiliates. Life/health insurance premiums written and earned in the United States included approximately $1.5 billion in<br />
2012 and 2011 and $2.1 billion in 2010 from a single contract with Swiss Re Life & Health America Inc., an affiliate of Swiss<br />
Reinsurance Company Ltd.<br />
Consolidated sales and service revenues in 2012, 2011 and 2010 were $83.3 billion, $72.8 billion and $67.2 billion,<br />
respectively. Approximately 84% of such amounts in 2012 were in the United States compared with approximately 86% in 2011<br />
and 88% in 2010. The remainder of sales and service revenues were primarily in Europe and Canada. In each of the three years<br />
ending December 31, 2012, consolidated sales and service revenues included approximately $12 billion of sales to Wal-Mart<br />
Stores, Inc., which were primarily related to McLane’s wholesale distribution business.<br />
Approximately 96% of our revenues in 2012 and 2011 from railroad, utilities and energy businesses were in the United<br />
States versus 97% in 2010. In each year, most of the remainder was attributed to the United Kingdom. At December 31, 2012,<br />
91% of our consolidated net property, plant and equipment was located in the United States with the remainder primarily in<br />
Europe and Canada.<br />
63