

BERKSHIRE HATHAWAY
BERKSHIRE HATHAWAY
BERKSHIRE HATHAWAY

You also want an ePaper? Increase the reach of your titles
YUMPU automatically turns print PDFs into web optimized ePapers that Google loves.
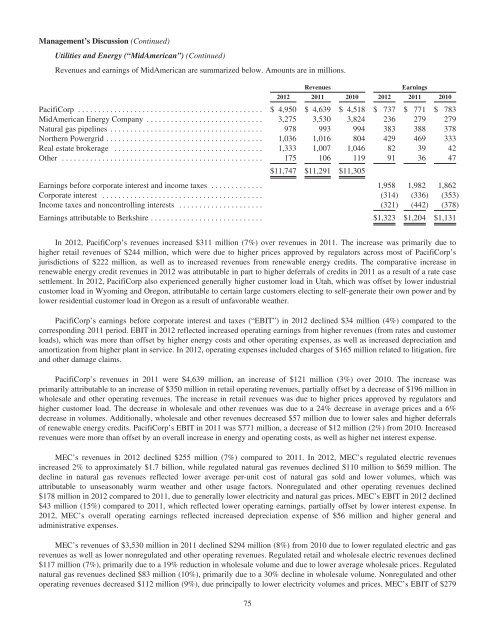
Management’s Discussion (Continued)<br />
Utilities and Energy (“MidAmerican”) (Continued)<br />
Revenues and earnings of MidAmerican are summarized below. Amounts are in millions.<br />
Revenues Earnings<br />
2012 2011 2010 2012 2011 2010<br />
PacifiCorp .............................................. $ 4,950 $ 4,639 $ 4,518 $ 737 $ 771 $ 783<br />
MidAmerican Energy Company ............................. 3,275 3,530 3,824 236 279 279<br />
Natural gas pipelines ...................................... 978 993 994 383 388 378<br />
Northern Powergrid ....................................... 1,036 1,016 804 429 469 333<br />
Real estate brokerage ..................................... 1,333 1,007 1,046 82 39 42<br />
Other .................................................. 175 106 119 91 36 47<br />
$11,747 $11,291 $11,305<br />
Earnings before corporate interest and income taxes ............. 1,958 1,982 1,862<br />
Corporate interest ........................................ (314) (336) (353)<br />
Income taxes and noncontrolling interests ..................... (321) (442) (378)<br />
Earnings attributable to Berkshire ............................ $1,323 $1,204 $1,131<br />
In 2012, PacifiCorp’s revenues increased $311 million (7%) over revenues in 2011. The increase was primarily due to<br />
higher retail revenues of $244 million, which were due to higher prices approved by regulators across most of PacifiCorp’s<br />
jurisdictions of $222 million, as well as to increased revenues from renewable energy credits. The comparative increase in<br />
renewable energy credit revenues in 2012 was attributable in part to higher deferrals of credits in 2011 as a result of a rate case<br />
settlement. In 2012, PacifiCorp also experienced generally higher customer load in Utah, which was offset by lower industrial<br />
customer load in Wyoming and Oregon, attributable to certain large customers electing to self-generate their own power and by<br />
lower residential customer load in Oregon as a result of unfavorable weather.<br />
PacifiCorp’s earnings before corporate interest and taxes (“EBIT”) in 2012 declined $34 million (4%) compared to the<br />
corresponding 2011 period. EBIT in 2012 reflected increased operating earnings from higher revenues (from rates and customer<br />
loads), which was more than offset by higher energy costs and other operating expenses, as well as increased depreciation and<br />
amortization from higher plant in service. In 2012, operating expenses included charges of $165 million related to litigation, fire<br />
and other damage claims.<br />
PacifiCorp’s revenues in 2011 were $4,639 million, an increase of $121 million (3%) over 2010. The increase was<br />
primarily attributable to an increase of $350 million in retail operating revenues, partially offset by a decrease of $196 million in<br />
wholesale and other operating revenues. The increase in retail revenues was due to higher prices approved by regulators and<br />
higher customer load. The decrease in wholesale and other revenues was due to a 24% decrease in average prices and a 6%<br />
decrease in volumes. Additionally, wholesale and other revenues decreased $57 million due to lower sales and higher deferrals<br />
of renewable energy credits. PacifiCorp’s EBIT in 2011 was $771 million, a decrease of $12 million (2%) from 2010. Increased<br />
revenues were more than offset by an overall increase in energy and operating costs, as well as higher net interest expense.<br />
MEC’s revenues in 2012 declined $255 million (7%) compared to 2011. In 2012, MEC’s regulated electric revenues<br />
increased 2% to approximately $1.7 billion, while regulated natural gas revenues declined $110 million to $659 million. The<br />
decline in natural gas revenues reflected lower average per-unit cost of natural gas sold and lower volumes, which was<br />
attributable to unseasonably warm weather and other usage factors. Nonregulated and other operating revenues declined<br />
$178 million in 2012 compared to 2011, due to generally lower electricity and natural gas prices. MEC’s EBIT in 2012 declined<br />
$43 million (15%) compared to 2011, which reflected lower operating earnings, partially offset by lower interest expense. In<br />
2012, MEC’s overall operating earnings reflected increased depreciation expense of $56 million and higher general and<br />
administrative expenses.<br />
MEC’s revenues of $3,530 million in 2011 declined $294 million (8%) from 2010 due to lower regulated electric and gas<br />
revenues as well as lower nonregulated and other operating revenues. Regulated retail and wholesale electric revenues declined<br />
$117 million (7%), primarily due to a 19% reduction in wholesale volume and due to lower average wholesale prices. Regulated<br />
natural gas revenues declined $83 million (10%), primarily due to a 30% decline in wholesale volume. Nonregulated and other<br />
operating revenues decreased $112 million (9%), due principally to lower electricity volumes and prices. MEC’s EBIT of $279<br />
75