


Tin Whisker Electrical Short Circuit Characteristics ... - NEPP - Nasa
Tin Whisker Electrical Short Circuit Characteristics ... - NEPP - Nasa
Tin Whisker Electrical Short Circuit Characteristics ... - NEPP - Nasa

You also want an ePaper? Increase the reach of your titles
YUMPU automatically turns print PDFs into web optimized ePapers that Google loves.
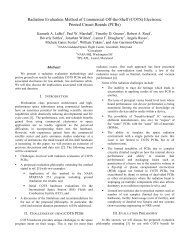
42 IEEE TRANSACTIONS ON ELECTRONICS PACKAGING MANUFACTURING, VOL. 32, NO. 1, JANUARY 2009<br />
Fig. 1. FIB image of as-sectioned tin whisker shows apparent variation in grain<br />
orientation within the cross section. The image was taken at a 52 angle from<br />
horizontal [NASA/University of Central Florida (UCF)]. Reproduced from [4].<br />
, , . The probability density<br />
function (pdf) for the 3P-IG distribution is shown as follows<br />
[7]:<br />
(1.1)<br />
Based on our data, the expected voltage (mean) where a short<br />
will occur for the 3P-IG distribution is Vdc,<br />
with a variance of [8]. <strong>Tin</strong> whiskers from<br />
the same card guide used in the breakdown voltage experiment<br />
were cross sectioned using an FEI 200 TEM FIB with a 30-kV<br />
Gallium liquid metal ion source. The ion beam was used to mill<br />
away whisker material until the desired region of interest was<br />
exposed to obtain a cross section normal to the whisker’s growth<br />
direction [4].<br />
The FIB cross section facilitated the examination of what appeared<br />
to be grains with varying crystallographic orientations<br />
within the tin whisker as illustrated in Fig. 1. An additional two<br />
whiskers from the card guide were removed and sectioned by<br />
the FIB. These smaller diameter whiskers exhibited the commonly<br />
reported single crystal structure.<br />
III. EXPERIMENTAL PROCEDURES<br />
A. <strong>Tin</strong> <strong>Whisker</strong> Breakdown Voltage Experiment<br />
To determine the break down voltage, a micromanipulator<br />
probe was brought in contact with the side of a tin whisker<br />
growing from a tin-plated beryllium copper card guides as illustrated<br />
in Fig. 2.<br />
The cantilever beam whisker model shown in Fig. 3 from our<br />
first paper illustrates the mechanical load placed on the whisker<br />
by the micromanipulator probe [4].<br />
In this model, the force applied to the whisker,<br />
the distance from the base of the whisker to the applied force,<br />
Fig. 2. Micromanipulator probe in contact with a tin whisker.<br />
Fig. 3. Cantilever beam whisker model. Reproduced from [4].<br />
the whisker deflection, the moment of inertia, and<br />
the modulus of elasticity [4].<br />
(1.2)<br />
From (1.2), the distance from the base of the whisker to the<br />
applied force has a much greater effect on the force applied to<br />
the whisker than the whisker deflection. Since our objective was<br />
to minimize the force applied to the whisker, the micromanipulator<br />
probe was applied to approximately the top 25% of the<br />
length of the whisker. In addition, as soon as contact was made<br />
between the micromanipulator probe and the whisker, as seen<br />
under a microscope, the probe was not moved any further. This<br />
minimized whisker deflection. The combination of these two<br />
controls minimizes the force applied to the whisker.<br />
Data acquisition software was written using LabVIEW to automate<br />
both the incrementing of power supply voltage changes<br />
as well as the gathering of the voltage and current data for each<br />
of the tin whiskers. The schematic diagram of the test station is<br />
shown in Fig. 4. Once contact was established, as determined<br />
with an optical microscope, the power supply voltage was increased<br />
from 0 to 45 Vdc in 0.1-Vdc increments [4]. This was<br />
the same software used in the first experiment.<br />
The software captured 3 to 4 samples per second over the entire<br />
voltage range. The automated test fixture was validated by<br />
substituting a calibrated resistor decade box for the micromanipulator,<br />
whisker, and card guide. The experiment was repeated<br />
to develop an empirical probability distribution of shorting as a<br />
function of voltage [4].<br />
Authorized licensed use limited to: University of Maryland College Park. Downloaded on January 12, 2009 at 16:34 from IEEE Xplore. Restrictions apply.

![mil-std-2223 [test methods for insulated electric wire] - NEPP](https://img.yumpu.com/4036001/1/190x249/mil-std-2223-test-methods-for-insulated-electric-wire-nepp.jpg?quality=85)