

Tin Whisker Electrical Short Circuit Characteristics ... - NEPP - Nasa
Tin Whisker Electrical Short Circuit Characteristics ... - NEPP - Nasa
Tin Whisker Electrical Short Circuit Characteristics ... - NEPP - Nasa

Create successful ePaper yourself
Turn your PDF publications into a flip-book with our unique Google optimized e-Paper software.
IEEE TRANSACTIONS ON ELECTRONICS PACKAGING MANUFACTURING, VOL. 32, NO. 1, JANUARY 2009 41<br />
<strong>Tin</strong> <strong>Whisker</strong> <strong>Electrical</strong> <strong>Short</strong> <strong>Circuit</strong><br />
<strong>Characteristics</strong>—Part II<br />
Karim J. Courey, Shihab S. Asfour, Arzu Onar, Jon A. Bayliss, Lawrence L. Ludwig, and Maria C. Wright<br />
Abstract—Existing risk simulations make the assumption that<br />
when a free tin whisker has bridged two adjacent exposed electrical<br />
conductors, the result is an electrical short circuit. This conservative<br />
assumption is made because shorting is a random event that<br />
has an unknown probability associated with it. Note however that<br />
due to contact resistance, electrical shorts may not occur at lower<br />
voltage levels. In our first paper, we developed an empirical probability<br />
model for tin whisker shorting. In this paper, we develop a<br />
more comprehensive empirical model using a refined experiment<br />
with a larger sample size, in which we studied the effect of varying<br />
voltage on the breakdown of the contact resistance which leads to a<br />
short circuit. From the resulting data, we estimated the probability<br />
distribution of an electrical short, as a function of voltage. In addition,<br />
the unexpected polycrystalline structure seen in the focused<br />
ion beam (FIB) cross section in the first experiment was confirmed<br />
in this experiment using transmission electron microscopy (TEM).<br />
The FIB was also used to cross section two card guides to facilitate<br />
the measurement of the grain size of each card guide’s tin plating<br />
to determine its finish.<br />
Index Terms—Contact resistance, focused ion beam (FIB), short<br />
circuit, tin whiskers, transmission electron microscopy (TEM).<br />
I. INTRODUCTION<br />
T<br />
IN WHISKERS are crystalline filamentary surface eruptions<br />
from a tin-plated surface that can have a variety<br />
of shapes including straight, kinked, and curved [1]. The hazards<br />
presented by tin whiskers include temporary and permanent<br />
electrical short circuits, debris contamination, and metal<br />
vapor arcing [2]. Failures attributed to metal whiskers have been<br />
documented in many industries including the nuclear power,<br />
Manuscript received July 31, 2008; revised October 28, 2008. Current version<br />
published January 08, 2009. This document was prepared under the sponsorship<br />
of the National Aeronautics and Space Administration. Neither the United States<br />
government nor any person acting on behalf of the United States government<br />
assumes any liability resulting from the use of the information contained in this<br />
document, or warrants that such use will be free from privately owned rights.<br />
This work was supported in part by S. Stich, S. M. Poulos, A. Oliu, J. N. Cowart,<br />
and S. J. McDanels of the National Aeronautics and Space Administration. This<br />
work was recommended for publication by Associate Editor R. Gedney upon<br />
evaluation of the reviewers comments.<br />
K. J. Courey is with the Orbiter Sustaining Engineering Office, National<br />
Aeronautics and Space Administration, Kennedy Space Center, FL 32899 USA<br />
(e-mail: karim.j.courey@nasa.gov).<br />
S. S. Asfour is with the College of Engineering, University of Miami, Coral<br />
Gables, FL 33146 USA (e-mail: sasfour@miami.edu).<br />
A. Onar is with the Biostatistics Department, St. Jude Children’s Research<br />
Hospital, Memphis, TN 38105 USA (e-mail: arzu.onar@stjude.org).<br />
J. A. Bayliss, L. L. Ludwig, and M. C. Wright are with the Materials<br />
Science Division, National Aeronautics and Space Administration,<br />
Kennedy Space Center, FL 32899 USA (e-mail: jon.a.bayliss@nasa.gov;<br />
lawrence.l.ludwig@nasa.gov; m.clara.wright@nasa.gov).<br />
Color versions of one or more of the figures in this paper are available online<br />
at http://ieeexplore.ieee.org.<br />
Digital Object Identifier 10.1109/TEPM.2008.2009224<br />
1521-334X/$25.00 © 2008 IEEE<br />
computer, satellite, missile, military aircraft, and medical industries<br />
[3]. An extensive list of metal whisker failures and extensive<br />
documentation of the tin whisker phenomena can be<br />
found on the National Aeronautics and Space Administration<br />
(NASA) Goddard Space Flight Center tin whisker home page<br />
(http://nepp.nasa.gov/WHISKER/).<br />
<strong>Tin</strong> whiskers can pose serious problems in high-reliability<br />
systems that can result in loss of life as well as significant capital<br />
losses. Improving our ability to assess the risk associated with<br />
tin whiskers is an important area of study for both the government<br />
and private industry [4].<br />
Risk simulations have been developed by the Center for Advanced<br />
Life Cycle Engineering (CALCE) at the University of<br />
Maryland, and TYCO Electronics [5], [6] . In these simulations,<br />
it is assumed that physical contact between a whisker and an<br />
exposed contact results in an electrical short. This conservative<br />
assumption was made because the probability of an electrical<br />
short from tin whiskers had not yet been determined at the time<br />
the simulations were written [4]. Fang [5] noted the difference<br />
between experiment and simulated results and attributed the difference<br />
to contact resistance.<br />
The voltage level at the transition to metallic conduction current<br />
is the voltage level at which the contact resistance breaks<br />
down. Experiments were designed to develop an empirical<br />
model to quantify the probability of occurrence of an electrical<br />
short circuit from tin whiskers as a function of voltage. In our<br />
first paper, we developed an empirical probability model for tin<br />
whisker shorting [4].<br />
The second experiment which is detailed in this paper incorporated<br />
the lessons learned from the first experiment. It determined<br />
the breakdown voltage for a larger sample (<br />
versus ) of whiskers with the objective of obtaining a<br />
more comprehensive empirical distribution. The observed data<br />
was used to determine the best fitting parametric distribution to<br />
the breakdown voltage. The associated data analysis also incorporated<br />
explorations of possible sources of variability. In addition,<br />
transmission electron microscopy (TEM) was used to study<br />
and determine if the whisker that was sectioned in the first experiment<br />
was polycrystalline or a single crystal. Also, an FIB<br />
was used to section a sample of one card guide from each ascent<br />
thrust vector controller (ATVC) to determine if the plating<br />
that grew the whiskers was bright or matte finish.<br />
II. BACKGROUND<br />
In our first experiment, we found the best fitting distribution<br />
was the three parameter (3P)-inverse Gaussian (IG) distribution<br />
[4]. The parameters for the 3P-IG Distribution were<br />
Authorized licensed use limited to: University of Maryland College Park. Downloaded on January 12, 2009 at 16:34 from IEEE Xplore. Restrictions apply.
42 IEEE TRANSACTIONS ON ELECTRONICS PACKAGING MANUFACTURING, VOL. 32, NO. 1, JANUARY 2009<br />
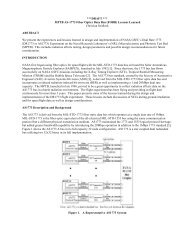
Fig. 1. FIB image of as-sectioned tin whisker shows apparent variation in grain<br />
orientation within the cross section. The image was taken at a 52 angle from<br />
horizontal [NASA/University of Central Florida (UCF)]. Reproduced from [4].<br />
, , . The probability density<br />
function (pdf) for the 3P-IG distribution is shown as follows<br />
[7]:<br />
(1.1)<br />
Based on our data, the expected voltage (mean) where a short<br />
will occur for the 3P-IG distribution is Vdc,<br />
with a variance of [8]. <strong>Tin</strong> whiskers from<br />
the same card guide used in the breakdown voltage experiment<br />
were cross sectioned using an FEI 200 TEM FIB with a 30-kV<br />
Gallium liquid metal ion source. The ion beam was used to mill<br />
away whisker material until the desired region of interest was<br />
exposed to obtain a cross section normal to the whisker’s growth<br />
direction [4].<br />
The FIB cross section facilitated the examination of what appeared<br />
to be grains with varying crystallographic orientations<br />
within the tin whisker as illustrated in Fig. 1. An additional two<br />
whiskers from the card guide were removed and sectioned by<br />
the FIB. These smaller diameter whiskers exhibited the commonly<br />
reported single crystal structure.<br />
III. EXPERIMENTAL PROCEDURES<br />
A. <strong>Tin</strong> <strong>Whisker</strong> Breakdown Voltage Experiment<br />
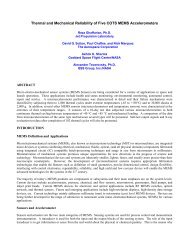
To determine the break down voltage, a micromanipulator<br />
probe was brought in contact with the side of a tin whisker<br />
growing from a tin-plated beryllium copper card guides as illustrated<br />
in Fig. 2.<br />
The cantilever beam whisker model shown in Fig. 3 from our<br />
first paper illustrates the mechanical load placed on the whisker<br />
by the micromanipulator probe [4].<br />
In this model, the force applied to the whisker,<br />
the distance from the base of the whisker to the applied force,<br />
Fig. 2. Micromanipulator probe in contact with a tin whisker.<br />
Fig. 3. Cantilever beam whisker model. Reproduced from [4].<br />
the whisker deflection, the moment of inertia, and<br />
the modulus of elasticity [4].<br />
(1.2)<br />
From (1.2), the distance from the base of the whisker to the<br />
applied force has a much greater effect on the force applied to<br />
the whisker than the whisker deflection. Since our objective was<br />
to minimize the force applied to the whisker, the micromanipulator<br />
probe was applied to approximately the top 25% of the<br />
length of the whisker. In addition, as soon as contact was made<br />
between the micromanipulator probe and the whisker, as seen<br />
under a microscope, the probe was not moved any further. This<br />
minimized whisker deflection. The combination of these two<br />
controls minimizes the force applied to the whisker.<br />
Data acquisition software was written using LabVIEW to automate<br />
both the incrementing of power supply voltage changes<br />
as well as the gathering of the voltage and current data for each<br />
of the tin whiskers. The schematic diagram of the test station is<br />
shown in Fig. 4. Once contact was established, as determined<br />
with an optical microscope, the power supply voltage was increased<br />
from 0 to 45 Vdc in 0.1-Vdc increments [4]. This was<br />
the same software used in the first experiment.<br />
The software captured 3 to 4 samples per second over the entire<br />
voltage range. The automated test fixture was validated by<br />
substituting a calibrated resistor decade box for the micromanipulator,<br />
whisker, and card guide. The experiment was repeated<br />
to develop an empirical probability distribution of shorting as a<br />
function of voltage [4].<br />
Authorized licensed use limited to: University of Maryland College Park. Downloaded on January 12, 2009 at 16:34 from IEEE Xplore. Restrictions apply.
COUREY et al.: TIN WHISKER ELECTRICAL SHORT CIRCUIT CHARACTERISTICS—PART II 43<br />
Fig. 4. Schematic diagram for the tin whisker test station instrumentation. Reproduced<br />
from [4].<br />
Fig. 5. <strong>Tin</strong> whisker test station probing area close up.<br />
B. Improvements to the Initial Experiment<br />
The following improvements were added to this experiment.<br />
Improved electrical grounding by connecting to the card<br />
guide instead of the card holding fixture.<br />
Gold-plated tungsten micromanipulator tips were used to<br />
minimize the effect of any oxides on the probe.<br />
The probe tip was cleaned every five whiskers with isopropyl<br />
alcohol.<br />
A solderer’s helper was modified to allow flexible positioning<br />
of the card guide and an extension platform for the<br />
microscope was fabricated to facilitate clamping of the lab<br />
jack (refer to Fig. 5).<br />
A ferrous top plate was fabricated for the lab jack to allow<br />
the magnetic base of the micromanipulator to be firmly<br />
mounted on the lab jack. The lab jack provided the coarse<br />
, , and movements, while the micromanipulator provided<br />
the fine , , and movements for probing the tin<br />
whiskers (refer to Fig. 5).<br />
C. Method of Sample Selection<br />
In the first experiment, all 35 whiskers tested were from the<br />
same card guide. In this experiment, card guides from two different<br />
line replaceable units (LRUs) were available for sampling.<br />
The card guides are from ATVC Serial Number 31 and<br />
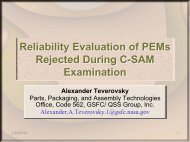
Fig. 6. FIB image showing removal of tin whisker section using the in situ<br />
needle (NASA/UCF).<br />
ATVC Serial Number 33. There are 28 card guides from each<br />
LRU; however, card guides that had been used for other experiments<br />
were removed from selection. Ten card guides were randomly<br />
selected from each LRU and five whiskers were tested<br />
from the top, and five whiskers were tested from the bottom of<br />
each card guide, resulting in a sample size of 200 whiskers.<br />
D. Sample Preparation for Transmission Electron Microscopy<br />
(TEM)<br />
An in situ focused ion beam (FIB) methodology was used to<br />
prepare a tin whisker cross-sectional sample for TEM examination.<br />
The first step was to deposit platinum on top of the region<br />
of interest (ROI) along the whisker to protect the whisker outer<br />
surface from the ion beam. Next, the ion beam was used to mill<br />
trenches on either side of the ROI of the whisker normal to the<br />
direction of growth leaving a small ( m) section of the<br />
whisker.<br />
Once the section was milled to a desired thickness, an in situ<br />
needle was lowered in preparation for removing the tin whisker<br />
section. The needle was spot welded to the whisker section using<br />
platinum, and the section was released from the carbon tape by<br />
milling away any remaining point of attachment with the FIB,<br />
as shown in Fig. 6.<br />
A conventional TEM copper grid was sectioned, and a small<br />
ditch was made on the grid inner surface with the FIB to accommodate<br />
the ROI. The tin whisker section was lowered and<br />
inserted in the copper grid in preparation for TEM examination.<br />
The section was first spot welded to the grid, and then released<br />
from the in situ needle. The last step prior to placing the grid<br />
and sample into the TEM was to thin out the sample using the<br />
FIB until a thickness of was achieved. The TEM images<br />
and diffraction patterns were taken using a FEI Tecani F30<br />
TEM with a 30-kV field emission source.<br />
Authorized licensed use limited to: University of Maryland College Park. Downloaded on January 12, 2009 at 16:34 from IEEE Xplore. Restrictions apply.
44 IEEE TRANSACTIONS ON ELECTRONICS PACKAGING MANUFACTURING, VOL. 32, NO. 1, JANUARY 2009<br />
Fig. 7. <strong>Tin</strong> whisker No. 137 graph of current versus time from the second<br />
experiment.<br />
Fig. 8. <strong>Tin</strong> whisker No. 137 graph of voltage versus time from the second<br />
experiment.<br />
IV. EXPERIMENTAL RESULTS<br />
A. <strong>Tin</strong> <strong>Whisker</strong> Breakdown Voltage<br />
The point at which a short occurs, when the film resistance<br />
breaks down, can easily be seen in Fig. 7 when the current<br />
jumps from near zero, the nanoamp range, to the milliamp range.<br />
Prior to breakdown the majority of the voltage drop is across<br />
the whisker due to the high resistance of the oxide film on the<br />
whisker. In this state, the whisker voltage reading tracks close to<br />
the power supply voltage. The power supply voltage increases<br />
linearly from 0 to 45 Vdc, then it remains at 45 Vdc for a few<br />
seconds at the end of the run until the software is given a stop<br />
command. After the film has broken down, the majority of the<br />
voltage drop is across the current limiting resistor. In this state,<br />
the low whisker voltage reading was determined by the small<br />
resistance of the whisker, card guide and micromanipulator as<br />
shown in Fig. 8.<br />
The voltage level at the transition to metallic conduction current<br />
is the voltage level at which the film and oxide layers break<br />
down. Reference Fig. 8. As in the first experiment, the graphs<br />
of voltage and current data showed single transitions, multiple<br />
transitions, and multiple transitions with intermittent contact.<br />
Fig. 9. Breakdown voltage individual value plot.<br />
The breakdown voltage for each of the 200 tin whiskers is displayed<br />
in Fig. 9. The breakdown voltage for each of the whiskers<br />
was selected first by visual review of the graphs as was done in<br />
the first experiment. To ensure that a more consistent approach<br />
was used in the data collection process in the second experiment,<br />
a computer-based method for selecting the breakdown voltage<br />
was developed using Microsoft Excel. All 200 breakdown voltages<br />
were verified using both methods.<br />
Since whiskers number 49 and 56 did not breakdown in the<br />
0 to 45 Vdc range used in this experiment, these two data points<br />
are considered censored. Minitab [9] was used in the second experiment<br />
because it contained a feature to easily accommodate<br />
censored data.<br />
B. Data Analysis<br />
The individual value plot shown in Fig. 9 provides insight<br />
into the data. The majority of the breakdown voltage values fall<br />
between 0 and 10 Vdc. The aforementioned figure shows tin<br />
whisker breakdown voltages versus card guide side where<br />
top and bottom, card guide, and LRU serial number. The<br />
right skewed nature of the data is evident from this plot. The<br />
individual values are shown in red.<br />
By default, Minitab explores the following 11 distributions<br />
for the best fit: Weibull, Lognormal, Exponential, Loglogistic,<br />
3-Parameter Weibull, 3-Parameter Lognormal, 2-Parameter<br />
Exponential, 3-Parameter Loglogistic, Smallest Extreme Value,<br />
Normal, and Logistic.<br />
In the first experiment, we used the Probability–Probability<br />
(P–P) plots along with the Kolmogorov–Smirnov test<br />
to determine the best fitting distribution. Since Minitab does<br />
not perform the Kolmogorov–Smirnov test, the adjusted Anderson–Darling<br />
test and correlation coefficient were used in<br />
its place, in addition to the P–P plots [4]. The adjusted Anderson–Darling<br />
test measures the area between the fitted line<br />
(based on chosen model) and the nonparametric step function<br />
(based on the plot points) [10].<br />
The correlation coefficient reported for each graph (distribution)<br />
measures the correlation between the data and what would<br />
be expected if the data comes from the specified distribution<br />
(represented by a line). If the data and the line are perfectly correlated,<br />
the correlation coefficient would be 1, and that would<br />
Authorized licensed use limited to: University of Maryland College Park. Downloaded on January 12, 2009 at 16:34 from IEEE Xplore. Restrictions apply.
COUREY et al.: TIN WHISKER ELECTRICAL SHORT CIRCUIT CHARACTERISTICS—PART II 45<br />
Fig. 10. Histogram tin whisker breakdown voltages with pdf of lognormal<br />
distribution.<br />
strongly indicate that the data probably came from the specified<br />
distribution. Note that even if one generated the data from<br />
a given distribution, typically the correlation coefficient would<br />
not equal to 1 due to random variability. However, larger correlation<br />
coefficients indicate that the “fit” of the probability plot<br />
is better. The correlation coefficient for the Lognormal distribution<br />
was 0.943.<br />
Based on the P–P plots and the correlation coefficients, the<br />
Anderson–Darling (adjusted) test, the applicability of the distributions,<br />
and the principle of parsimony the Lognormal distribution<br />
was chosen as the best fitting model for the data<br />
The pdf for the Lognormal distribution is shown in (1.3)<br />
below [10] as<br />
(1.3)<br />
From the data, the estimated of the location parameter<br />
, and the scale parameter<br />
were obtained. The pdf along with a histogram of the breakdown<br />
voltage data is shown in Fig. 10.<br />
Based on the data and the fitted model, the expected (mean)<br />
voltage where a short will occur is 8.0067 Vdc, with a standard<br />
deviation of 7.2812 Vdc. The median tin whisker breakdown<br />
voltage is 5.9236 Vdc.<br />
C. Comparison of First and Second Experiment Results<br />
The empirical probability distributions derived from the data<br />
gathered in the first and the second experiments were the 3P-IG<br />
and the Lognormal distributions, respectively. It is important to<br />
note that EasyFit was used for fitting the distribution in the first<br />
experiment, and Minitab was used for fitting the distribution in<br />
the second experiment. Minitab contained a feature to easily<br />
handle censored data. The IG distribution is not evaluated by<br />
Minitab, and thus was not a choice in the second experiment.<br />
Takagi noted that the probability density functions of the IG and<br />
the Lognormal distributions are similar in shape [10]. The probability<br />
density functions for both experiments are right skewed.<br />
The larger sample size in the second experiment likely results<br />
in a better estimate of the tail of the distribution.<br />
To aid in comparing the results of the second experiment to<br />
first experiment, the data from the first experiment was analyzed<br />
using Minitab. Based on the P-P plots, adjusted Anderson–Darling<br />
test, and the correlation coefficient, the Lognormal was the<br />
best fitting distribution using Minitab. From this analysis, it was<br />
evident that the first and second experiments are consistent when<br />
using the same software for fitting the distributions.<br />
Based on the data and the fitted model for the first experiment,<br />
the expected voltage (mean) where a short will occur is<br />
15.5994 Vdc, and the median tin whisker breakdown voltage<br />
is 11.8924 Vdc. Based on the data and the fitted model for the<br />
second experiment, the expected voltage (mean) where a short<br />
will occur is 8.0067 Vdc, and the median tin whisker breakdown<br />
voltage is 5.9236 Vdc. The shift in the mean can be explained<br />
partially by the change to a gold-plated probe tip in the second<br />
experiment, thus eliminating any effect of oxides on the probe<br />
tip.<br />
D. <strong>Tin</strong> <strong>Whisker</strong> Current Carrying <strong>Characteristics</strong><br />
Since the power supply was limited to 45 Vdc in this experiment,<br />
and the current limiting resistor was 10 k , the current<br />
through the whisker was limited to 4.5 mA. 158 out of 200<br />
whiskers or 79% (95% Confidence Interval (72.69%, 84.43%))<br />
of the whiskers were able to carry 4.5 mA. In some circuits, this<br />
current-carrying capability is enough to cause permanent short<br />
circuits.<br />
E. Limitations<br />
Two whiskers in the second experiment did not experience a<br />
breakdown of the film resistance in the 0–45 Vdc range of the<br />
experiment. This resulted in two censored values out of the 200<br />
whiskers tested. Increasing the upper voltage limit of the power<br />
supply voltage could eliminate the censoring.<br />
The difference and variation between force applied by gravity<br />
and the force applied by the micromanipulator probe was another<br />
limitation. To improve control of the applied pressure in<br />
the second experiment, the probe was applied to the whisker<br />
on approximately the top 25% of the whisker. This minimizes<br />
the applied pressure, but does not completely eliminate the<br />
difference.<br />
Another limitation of this experiment is the number of conducting<br />
surfaces. A free whisker falling across two contacts will<br />
have two points of contact for breakdown, while the micromanipulator<br />
probe contacts the whisker at one point. This was accepted<br />
simplification in this experiment.<br />
To simulate a loose whisker bridging electrical contacts,<br />
all of the testing done in this experiment was performed by<br />
bringing the probe in contact with the side of a whisker. However,<br />
whiskers can also cause short circuits when a whisker<br />
grows from one lead and the tip of the whisker contacts an<br />
adjacent lead. In this case, with tip contact, the results may be<br />
different from those obtained with side contact due to contact<br />
area and force.<br />
F. Transmission Electron Microscopy (TEM)<br />
During the preliminary tin whisker characterization in the<br />
first experiment, FIB analysis and ion channeling imaging re-<br />
Authorized licensed use limited to: University of Maryland College Park. Downloaded on January 12, 2009 at 16:34 from IEEE Xplore. Restrictions apply.
46 IEEE TRANSACTIONS ON ELECTRONICS PACKAGING MANUFACTURING, VOL. 32, NO. 1, JANUARY 2009<br />
Fig. 11. Bright field TEM image of the polycrystalline tin whisker and nomenclature used to identify the various regions (A-D). Regions A–C were nearly identical<br />
with one another, while region D was misoriented by approximately 2 with region A (NASA/UCF).<br />
vealed what appeared to be a polycrystalline whisker (refer to<br />
Fig. 1). In order to determine whether the whisker was polycrystalline,<br />
a thin section was prepared for TEM analysis as shown<br />
in Fig. 11. This sample is from a different section of the same tin<br />
whisker shown in the Fig. 1, but is rotated as evident by the location<br />
of the deposited platinum layer. The selected area diffraction<br />
patterns (SADPs) were taken at four site specific regions,<br />
labeled A, B, C, and D as shown in Fig. 11.<br />
The SADPs obtained from regions A–D indexed to the tetragonal<br />
crystal structure of tin in the beam direction (refer<br />
to Fig. 11). Region D was misoriented approximately 2 with<br />
respect to region A in the (121) direction. Regions A–C were<br />
nearly identical with one another.<br />
High-resolution TEM imaging, shown in Fig. 12, was used<br />
to image an amorphous region between uniform crystal lattices<br />
of regions A and B, which clearly delineates a grain boundary<br />
between the crystals in the polycrystalline tin whisker. Additionally,<br />
X-ray energy dispersive spectroscopy (EDS) was used<br />
to verify that there were no compositional differences between<br />
the regions, all were composed of pure tin (Sn). The polycrystalline<br />
structure of the studied whisker is shown by the contrast<br />
in regions A–D in the bright field TEM image in Fig. 11, the<br />
misorientation of region D with respect to region A shown in<br />
the SADPs, and the amorphous region between the crystals in<br />
the high-resolution TEM image in Fig. 12.<br />
G. Card Guide Cross Sections Using a FIB<br />
FIB analysis of two card guides was used to determine the<br />
grain size and thickness of the tin plating. Ion channel imaging<br />
was used to acquire images showing distinct grains based on<br />
Fig. 12. High-resolution TEM image of the amorphous region in the polycrystalline<br />
tin whisker between the uniform crystal lattices of regions A and<br />
B. The amorphous region is a low-angle grain boundary (NASA/UCF).<br />
crystal orientation contrast as shown in Fig. 13. Using a modified<br />
line-intercept method, the average grain size for the card<br />
guide from ATVC S/N 31 shown in Fig. 13 was estimated to be<br />
0.350 m (350 nm), and the average grain size for the card guide<br />
from ATVC S/N 33 was estimated to be 0.290 m (290 nm),<br />
Authorized licensed use limited to: University of Maryland College Park. Downloaded on January 12, 2009 at 16:34 from IEEE Xplore. Restrictions apply.
COUREY et al.: TIN WHISKER ELECTRICAL SHORT CIRCUIT CHARACTERISTICS—PART II 47<br />
Fig. 13. FIB ion channeling image of card guide 16 (ATVC S/N 31) cross section showing the distinct layers studied: the expected Cu–Be substrate with "m-sized<br />
grains, the Sn plating with nm-sized grains, the Au–Pd sputter coating and finally the deposited Pt used to protect the region during FIB analysis (NASA/UCF).<br />
which falls well below the lowest grain size in the ASTM grain<br />
size number charts (grain size number ) [11] .<br />
Fig. 13 shows the copper–beryllium (Cu–Be) substrate base<br />
metal and the tin Sn plating. A layer of gold-palladium (Au-Pd)<br />
was sputter coated on top of the tin plating prior to the FIB sectioning,<br />
and a layer of platinum (Pt) was deposited along the region<br />
of interest in the FIB to protect the sample during ion beam<br />
milling. The average thicknesses of the Sn layers are 6.9 m and<br />
2.7 m for the card guides from ATVC S/N 31 and 33, respectively.<br />
EDS in a field-emission SEM was used to confirm the<br />
composition of each layer. The presence of beryllium cannot<br />
be confirmed using this technique since EDS will only accurately<br />
detect elements with a higher atomic number than Boron.<br />
However, the original drawings show the base metal for the card<br />
guide as copper–beryllium.<br />
The purpose of measuring the grain size was to quantitatively<br />
determine the finish of the tin plating. Shetty classified large<br />
grain matte finish as having a grain size between 3–8 m, fine<br />
grain matte finish as having a grain size between 1-2 m, and<br />
bright finish as having a grain size m [12] . Based on<br />
these criteria, the tin plating used in both ATVC S/N 31 and<br />
33 can be classified as bright finish. While tin finish was not a<br />
variable in this experiment, it is a point of interest because bright<br />
tin finishes have been associated with greater tin whisker growth<br />
than matte tin finishes [13], [14].<br />
V. CONCLUSION<br />
An empirical model to quantify the probability of occurrence<br />
of an electrical short circuit from tin whiskers as a function of<br />
voltage was developed in the first experiment [4]. It provided<br />
insight into the right skewed shape of the probability model.<br />
The 3P–Inverse Gaussian distribution was used to describe the<br />
whisker breakdown voltage in this experiment. This probability<br />
model also provided the baseline for a simulation to evaluate the<br />
sample size for the second experiment. In the first experiment,<br />
a sample size of 35 tin whiskers was used. In the second experiment,<br />
a sample size of 200 tin whiskers was used to improve<br />
the accuracy of the probability model. The Lognormal distribution<br />
was found to be the best fitting distribution to describe the<br />
whisker breakdown voltage in the second experiment.<br />
The lessons learned from first experiment also aided in improving<br />
the equipment and procedures for the second experiment.<br />
The modified solder’s helper, extension platform, and the<br />
ferrous top plate greatly improved the ability to clearly see and<br />
probe the whiskers under a microscope.<br />
Three tin whiskers were cross sectioned using an FIB for<br />
study. Two of the whiskers exhibited the commonly reported<br />
single crystal structure. One whisker showed apparent variation<br />
in grain orientation within the cross section. Further examination<br />
was performed using a TEM. High-resolution TEM<br />
imaging was used to examine an amorphous region between uniform<br />
crystal lattices. This clearly delineates a grain boundary<br />
between the crystals in the polycrystalline tin whisker. SADPs<br />
indicated a 2 misorientation between two regions. The polycrystalline<br />
structure of the tin whisker is shown by the TEM<br />
images and the SADPs.<br />
In addition, since bright tin finishes have been associated with<br />
greater tin whisker growth than matte tin finishes, two card samples<br />
were prepared, one from each LRU, and were sectioned<br />
using a FIB. Using a modified line-intercept method, the average<br />
grain size for the card guides’ tin finish was determined<br />
to be in the nm-range, indicative of a bright finish.<br />
Authorized licensed use limited to: University of Maryland College Park. Downloaded on January 12, 2009 at 16:34 from IEEE Xplore. Restrictions apply.
48 IEEE TRANSACTIONS ON ELECTRONICS PACKAGING MANUFACTURING, VOL. 32, NO. 1, JANUARY 2009<br />
A. Future Work<br />
There are many aspects of the tin whisker phenomena that<br />
provide opportunities for future research. One area that would<br />
expand on the research performed here would be to study the effect<br />
of pressure on breakdown voltage. This would require the<br />
development of a method measuring pressure applied to the tin<br />
whisker either directly or indirectly by measuring whisker deflection,<br />
length and diameter and then calculating the pressure.<br />
Expanding the range of the power beyond the 0–45 Vdc to<br />
determine the upper limit of breakdown voltage would also provide<br />
additional insight. By expanding the upper limit one may<br />
be able to eliminate the censored data points.<br />
Other variables that could affect tin whisker shorting should<br />
also be studied. Some examples of these variables that warrant<br />
future study include whisker shape, whisker length and thickness,<br />
and oxidation layer thickness. Another phenomenon related<br />
to tin whiskers that warrants further quantification is metal<br />
vapor arcing.<br />
ACKNOWLEDGMENT<br />
The authors would like to thank Dr. H. Leidecker of NASA<br />
and J. Brusse of Perot Systems at Goddard Space Flight Center<br />
for sharing their vast knowledge on the topic of tin whiskers,<br />
and taking the time to answer the many questions posed<br />
throughout this experiment. The authors would also like to<br />
thank Z. Rahman with the Materials Characterization Facility,<br />
AMPAC, University of Central Florida (UCF), for his expertise<br />
in FIB and TEM analysis, M. Spates, P. Marciniak, S. Loucks,<br />
J. Neihoff, P. Richiuso, and R. King of NASA Kennedy Space<br />
Center for their help with the fabrication/modification of the test<br />
equipment, L. Batterson of NASA Kennedy Space Center for<br />
his expertise in photography, A. Oliu of NASA Johnson Space<br />
Center for his expertise with digital imaging, Dr. L. Keller of<br />
NASA Johnson Space Center and Dr. J. Lomness of NASA<br />
Kennedy Space Center for reviewing the diffraction patterns,<br />
Dr. S. Smith of NASA and Dr. R. N. Shenoy of Lockheed<br />
Martin at NASA Langley Research Center for indexing the<br />
diffraction patterns, and M. Madden of United Space Alliance<br />
for his expertise with breakdown voltage selection software.<br />
REFERENCES<br />
[1] G. T. Galyon, “Annotated tin whisker bibliography and anthology,”<br />
IEEE Trans. Electron. Packag. Manuf., vol. 28, no. 1, pp. 94–122, Jan.<br />
2005.<br />
[2] J. Brusse, G. Ewell, and J. Siplon, “<strong>Tin</strong> whiskers: Attributes and mitigation,”<br />
in Proc. Capacitor and Resistor Technol. Symp., 2002, pp.<br />
67–80.<br />
[3] H. Leidecker and J. Brusse, “<strong>Tin</strong> whiskers: A history of documented<br />
electrical system failures—A briefing,” Space Shuttle Program<br />
Office, 2006 [Online]. Available: http://nepp.nasa.gov/whisker/reference/tech_papers/2006-Leidecker-<strong>Tin</strong>-<strong>Whisker</strong>-Failures.pdf.<br />
[4] K. J. Courey, S. S. Asfour, J. A. Bayliss, L. L. Ludwig, and M. C.<br />
Zapata, “<strong>Tin</strong> whisker electrical short circuit characteristics—Part I,”<br />
IEEE Trans. Electron. Packag. Manuf., vol. 31, no. 1, pp. 32–40, Jan.<br />
2008.<br />
[5] T. Fang, “<strong>Tin</strong> whisker risk assessment studies,” DAI-B, 2005, vol.<br />
66(12) [Online]. Available: https://drum.umd.edu/dspace/handle/<br />
1903/3079<br />
[6] R. D. Hilty and N. E. Corman, “<strong>Tin</strong> whisker reliability assessment by<br />
Monte Carlo simulation,” in Proc. IPC/JEDEC Lead-Free Symp., 2005,<br />
pp. 1–8.<br />
[7] EasyFit. [Electronic] Mathwave Technologies, 2007, vol. 3.2 [Online].<br />
Available: http://www.mathwave.com/products/easyfit.html<br />
[8] I. A. Koutrouvelis, G. C. Canavos, and S. G. Meintanis, “Estimation in<br />
the three-parameter inverse Gaussian distribution,” in Comput. Statist.<br />
Data Anal., Jun. 15, 2005, vol. 49, pp. 1132–1147.<br />
[9] “Minitab Release 14 Statistical Software,” Minitab Inc., 2003 [Online].<br />
Available: http://www.minitab.com/products/<br />
[10] K. Takagi, S. Kumagai, C. Matsunaga, and Y. Kusaka, “Application<br />
of inverse Gaussian distribution to occupational exposure data,” The<br />
Annals of Occupational Hygiene, vol. 41, pp. 505–514, Oct. 1997.<br />
[11] “Standard Test Methods for Determining Average Grain Size,” American<br />
Society for Testing and Materials, ASTM International, West Conshohocken,<br />
PA, 2006 [Online]. Available: www.astm.org.<br />
[12] R. Schetty, “Electrodeposited tin properties & their effect on component<br />
finish reliability,” in Proc. 2004 Int. Conf. Business of Electron.<br />
Product Reliability and Liability, 2004, pp. 29–34.<br />
[13] J. Smetana, “Minimizing tin whiskers,” SMT Surface Mount Technol.<br />
Mag., vol. 19, pp. 36–38, 2005.<br />
[14] M. Osterman, in Proc. Mitigation Strategies for <strong>Tin</strong> <strong>Whisker</strong>s, Jul. 3,<br />
2002, vol. 2006.<br />
Karim J. Courey received the B.E.E. degree from Cleveland State University,<br />
Cleveland, OH, in 1986, the M.B.A. degree from the Florida Institute of Technology,<br />
Melbourne, FL, in 1993, and the Ph.D. degree in industrial engineering<br />
from the University of Miami, Coral Gables, FL, in 2008.<br />
He is currently a Principal Engineer with the Orbiter Sustaining Engineering<br />
Office for the National Aeronautics and Space Administration, Lyndon B.<br />
Johnson Space Center, Texas. His duty location is at the John F. Kennedy<br />
Space Center in Florida.<br />
Dr. Courey is a licensed Professional Engineer in the state of Texas.<br />
Shihab S. Asfour received the B.S. and M.S. degrees in production engineering<br />
from Alexandria University, Alexandria, Egypt, in 1973 and 1976, respectively,<br />
and the Ph.D. degree in industrial engineering and psychology from Texas Tech<br />
University, Lubbock, in 1980.<br />
He is currently Professor and Associate Dean of the College of Engineering at<br />
the University of Miami, Coral Gables, FL. He has over 30 years of instructional,<br />
professional and research experience and has authored over 200 publications.<br />
He has 17 recent publications in both biomechanical and industrial engineering<br />
and has also supervised 18 Ph.D. dissertations.<br />
Arzu Onar received the B.S. degree in mathematical sciences at the University<br />
of North Carolina, Chapel Hill, in 1993 and the M.S. and Ph.D. degrees<br />
in statistics from University of South Carolina, Columbia, in 1995 and 1998,<br />
respectively.<br />
She is currently a faculty member at the Biostatistics Department, St. Jude<br />
Children’s Research Hospital, Memphis, TN. Her research interests are in statistical<br />
reliability and in survival analysis.<br />
Jon A. Bayliss received the A.S. degree in computer engineering technology<br />
from Tampa Technical Institute, Tampa, FL, in 1979, and the B.S. degree in<br />
electrical engineering from the Florida Institute of Technology, Melbourne, in<br />
1986.<br />
He is currently an <strong>Electrical</strong> Engineer in the Electronic Failure Analysis Section,<br />
Engineering Directorate for the National Aeronautics and Space Administration,<br />
Kennedy Space Center, FL.<br />
Lawrence L. Ludwig received the B.S. degree in electrical engineering from<br />
the Florida Institute of Technology, Melbourne, in 1986 and the M.S. degree<br />
in engineering management from the University of Central Florida, Orlando, in<br />
1992.<br />
He is currently a Lead <strong>Electrical</strong> Engineer in Electronic Failure Analysis Section,<br />
Engineering Directorate for the National Aeronautics and Space Administration,<br />
Kennedy Space Center, FL.<br />
Maria C. Wright received the B.S. degree in materials science and engineering<br />
from the University of Florida, Gainesville, in 2002 and the M.S. degree in materials<br />
science and engineering from the Pennsylvania State University, University<br />
Park, in 2005.<br />
She is currently a Materials Engineer in the Materials Failure Analysis Section,<br />
Engineering Directorate for the National Aeronautics and Space Administration<br />
at Kennedy Space Center, FL.<br />
Authorized licensed use limited to: University of Maryland College Park. Downloaded on January 12, 2009 at 16:34 from IEEE Xplore. Restrictions apply.


![mil-std-2223 [test methods for insulated electric wire] - NEPP](https://img.yumpu.com/4036001/1/190x249/mil-std-2223-test-methods-for-insulated-electric-wire-nepp.jpg?quality=85)