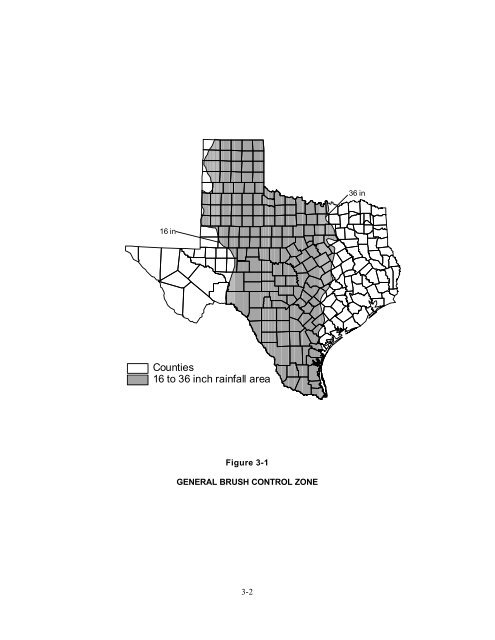
16 in Counties 16 to 36 inch rainfall area # Figure 3-1 GENERAL BRUSH CONTROL ZONE 3-2 # 36 in
The western <strong>and</strong> southern portions of the study area are within the Mesquite Plains natural subregion of <strong>Texas</strong> (LBJ School of Public Affairs, 1978), a gently rolling plain of mesquite-short grass savanna formed on s<strong>and</strong>stone, shale <strong>and</strong> limestone substrate (Figure 3-3). The eastern margin of the watershed is included in the Lampasas Cut Plain natural subregion, which is characterized by grassl<strong>and</strong> <strong>and</strong> scattered mesquite woods on low rolling hills underlain by limestone. Surface elevations in the watershed vary from approximately 1,380 feet above mean sea level (msl) along Pecan Bayou immediately downstream of <strong>Lake</strong> <strong>Brownwood</strong> to approximately 2,200 feet msl in the upper reaches of the watershed. The northern boundary of the watershed is marked by a low range of hills known as the Callahan Divide, which separates the Colorado River basin on the south from the Brazos River basin on the north. Geology The <strong>Lake</strong> <strong>Brownwood</strong> watershed is underlain by approximately 4,000 feet of Paleozoic (Permian <strong>and</strong> Pennsylvanian) rock strata comprised of limestone, dolomite, shale <strong>and</strong> clastics that dip to the northwest at an average rate of 50 feet per mile. Up to 100 feet of Cretaceous rock strata unconformably overlie the Paleozoic rocks, in portions of the watershed. The Cretaceous rocks consist of s<strong>and</strong>stone, shaly limestone <strong>and</strong> limestone <strong>and</strong> are exposed at the surface mainly along the eastern margin of the study area. However, they also occur as erosional remnants, or outliers, in the localized areas in the western part of the watershed. In contrast to the Paleozoic rocks, the Cretaceous beds dip gently southeastward. Thin deposits of Quaternary age s<strong>and</strong>, silt, clay <strong>and</strong> caliche unconformably overlie the Paleozoic rocks in the western portions of the watershed, <strong>and</strong> recent (Holocene) alluvium deposits occur throughout the watershed in the floodplains of the larger streams. The Paleozoic rocks, the lowermost Cretaceous rocks, <strong>and</strong> the alluvium are sources of small to moderate amounts of fresh to saline groundwater in the watershed. Climate The <strong>Lake</strong> <strong>Brownwood</strong> watershed has a subtropical, subhumid to semiarid climate, with typically dry winters <strong>and</strong> hot humid summers. The distribution of monthly rainfall has two peaks. Spring is typically the wettest season, with a peak occurring in May. The second peak is usually in September, coinciding with the tropical cyclone season in the late summer/early fall. Spring rains are typified by convective thunderstorms that produce high intensity, short duration rainfall events <strong>and</strong> rapid runoff. Fall rains are primarily governed by tropical storms <strong>and</strong> hurricanes that originate in the Caribbean Sea or the Gulf of Mexico <strong>and</strong> make l<strong>and</strong>fall on the coast from Louisiana to Mexico. For the past century, annual precipitation in the watershed has varied from approximately 10.7 to 50.6 inches <strong>and</strong> averaged 25.9 inches. From 1940 to 1997, monthly gross evaporation in the watershed varied from approximately 2.5 to 9.2 inches. The average annual gross evaporation was approximately 67.3 inches. L<strong>and</strong> Use The six-county area in which the watershed is located is primarily rural, with approximately 56 percent of the l<strong>and</strong> used for ranching <strong>and</strong> 29 percent for farming. Animal production is dominated by cattle, but includes sheep, hogs <strong>and</strong> poultry. Wheat <strong>and</strong> hay are the dominant crops, followed by cotton <strong>and</strong> sorghum. Foods crops include peaches, pecans <strong>and</strong> peanuts. The largest surface water body in the watershed is <strong>Lake</strong> <strong>Brownwood</strong>, which has a usable conservation storage capacity of 131,430 acre-feet. The second largest water supply reservoir in the watershed is <strong>Lake</strong> Coleman (40,000 acre-feet) on Jim Ned Creek approximately 14 miles north of Coleman. Additional reservoirs include Hords Creek <strong>Lake</strong> (8,110 acre-feet) approximately 13 miles west of Coleman <strong>and</strong> <strong>Lake</strong> Clyde (5,748 acre-feet) approximately six miles south of Clyde. Recreation in the watershed centers on the <strong>Lake</strong> <strong>Brownwood</strong> <strong>State</strong> Park. Population The <strong>Lake</strong> <strong>Brownwood</strong> watershed is primarily rural, but contains numerous small communities that serve the rural population. Abilene, which has a population of approximately 120,000, is in Taylor County immediately northwest of the watershed. 3-3
- Page 1 and 2: Lake Brownwood Watershed Brush Cont
- Page 3 and 4: LAKE BROWNWOOD WATERSHED Brush Cont
- Page 5 and 6: LIST OF FIGURES Figure Page 3-1 Gen
- Page 7 and 8: 1.0 INTRODUCTION In 1985, the Texas
- Page 9: 3.0 HYDROLOGIC EVALUATION The follo
- Page 13 and 14: µ Blackland Prairies Rolling Plain
- Page 15 and 16: Early travelers knew the location o
- Page 17 and 18: Some of the native grasses that con
- Page 19 and 20: Figure 3-5 2000 Watershed Vegetatio
- Page 21 and 22: The gauge at Brownwood has the long
- Page 23 and 24: Figure 3-6 Geologic Map of the Stud
- Page 25 and 26: Artificial discharge of groundwater
- Page 27 and 28: 4.0 REFERENCES Allred, B.W. 1956. M
- Page 29 and 30: APPENDIX 1 BRUSH / WATER YIELD FEAS
- Page 31 and 32: land use, weather, management, and
- Page 33 and 34: Water Ponds, reservoirs, and large
- Page 35 and 36: Hydrologic Response Units (HRU). Th
- Page 37 and 38: Brush Removal Simulations All water
- Page 39 and 40: LITERATURE CITED Arnold, J.G., P.M.
- Page 41 and 42: A1-13 Lake Arrowhead Lake Fort Phan
- Page 43 and 44: Lake Inflow Increase (acre-feet/yr)
- Page 45 and 46: (2002), and TAES (2000). Points are
- Page 47 and 48: Objectives This Chapter reports the
- Page 49 and 50: competition for light, water and nu
- Page 51 and 52: several reasons why this will not l
- Page 53 and 54: Table 2-1. Cost of Water Yield Brus
- Page 55 and 56: Table 2-3. NPV Report - Lake Brownw
- Page 57 and 58: Table 2-5. Cost of Added Water From
- Page 59 and 60: METHODS Land Use/Land Cover The lan
- Page 61 and 62:
Ponds and Reservoirs Surface runoff
- Page 63 and 64:
of increased water yield were expec
- Page 65 and 66:
Table 3-2. Subbasin data, Lake Brow
- Page 67 and 68:
Figure 3-2. Climate and stream gage
- Page 69 and 70:
Storage (Ac-Ft) 14,000 12,000 10,00
- Page 71 and 72:
Figure 3-5. Measured and predicted
- Page 73 and 74:
Figure 3-7. Cumulative monthly meas
- Page 75 and 76:
Figure 3-9. Cumulative monthly meas
- Page 77 and 78:
Figure 3-11. Predicted cumulative s
- Page 79 and 80:
APPENDIX 4 LAKE BROWNWOOD WATERSHED
- Page 81 and 82:
COST OF ADDITIONAL WATER The total
- Page 83 and 84:
Table 4-1. Cost of Water Yield Brus
- Page 85 and 86:
Table 4-2. Grazing Capacity With an
- Page 87 and 88:
Table 4-4. Landowner/State Cost-Sha
- Page 89:
38 910322.94 612035792.59 1878.27 1