Lake Brownwood Watershed - Texas State Soil and Water ...
Lake Brownwood Watershed - Texas State Soil and Water ...
Lake Brownwood Watershed - Texas State Soil and Water ...
You also want an ePaper? Increase the reach of your titles
YUMPU automatically turns print PDFs into web optimized ePapers that Google loves.
The soils database currently available for all of <strong>Texas</strong> is the <strong>State</strong> <strong>Soil</strong> Geographic (STATSGO)<br />
1:250,000-scale soils database, which covers the entire United <strong>State</strong>s. In the STATSGO<br />
database, each soil delineation or mapping unit is made up of more than one soil series. Some<br />
STATSGO mapping units contain as many as twenty SSURGO soil series. The dominant<br />
SSURGO soil series within an individual STATSGO polygon was selected to represent that area.<br />
The GIS layer representing the soils within each watershed was a compilation of CBMS,<br />
SSURGO, <strong>and</strong> STATSGO information. The most detailed information available was selected for<br />
each county <strong>and</strong> patched together to create the final soils layer. SSURGO data was available for<br />
approximately 90 percent of Phantom Hill <strong>and</strong> 75 percent of Palo Pinto watersheds. CBMS soils<br />
were used in about 90 percent of <strong>Brownwood</strong> <strong>and</strong> essentially all of Arrowhead watersheds. Very<br />
little STATSGO soils were used in any of the watersheds.<br />
SWAT used the soils series name as the data link between the soils GIS layer <strong>and</strong> the soils<br />
properties database. County soil surveys were used to verify data for selected dominant soils<br />
within each watershed.<br />
Topography. The United <strong>State</strong>s Geological Survey (USGS) database known as Digital<br />
Elevation Model (DEM) describes the surface of a watershed as a topographical database.<br />
The DEM available for the project area is a 1:24,000 scale map. The resolution of the DEM is<br />
30 meters, allowing detailed delineation of watershed boundaries (Figure 1-1) <strong>and</strong> subbasins<br />
within each watershed (Table 1-2).<br />
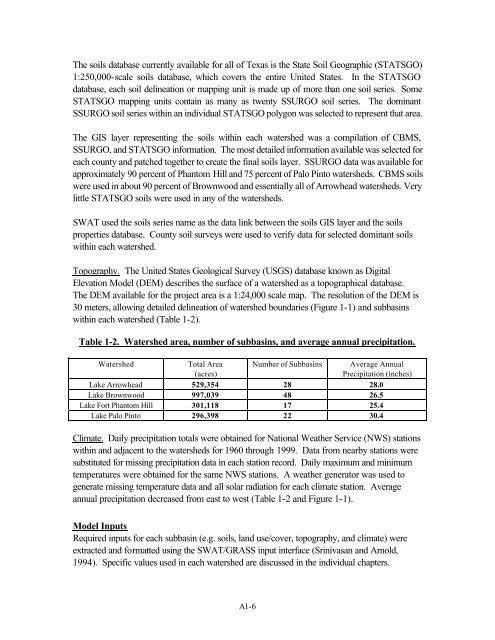
Table 1-2. <strong><strong>Water</strong>shed</strong> area, number of subbasins, <strong>and</strong> average annual precipitation.<br />
<strong><strong>Water</strong>shed</strong> Total Area Number of Subbasins Average Annual<br />
(acres)<br />
Precipitation (inches)<br />
<strong>Lake</strong> Arrowhead 529,354 28 28.0<br />
<strong>Lake</strong> <strong>Brownwood</strong> 997,039 48 26.5<br />
<strong>Lake</strong> Fort Phantom Hill 301,118 17 25.4<br />
<strong>Lake</strong> Palo Pinto 296,398 22 30.4<br />
Climate. Daily precipitation totals were obtained for National Weather Service (NWS) stations<br />
within <strong>and</strong> adjacent to the watersheds for 1960 through 1999. Data from nearby stations were<br />
substituted for missing precipitation data in each station record. Daily maximum <strong>and</strong> minimum<br />
temperatures were obtained for the same NWS stations. A weather generator was used to<br />
generate missing temperature data <strong>and</strong> all solar radiation for each climate station. Average<br />
annual precipitation decreased from east to west (Table 1-2 <strong>and</strong> Figure 1-1).<br />
Model Inputs<br />
Required inputs for each subbasin (e.g. soils, l<strong>and</strong> use/cover, topography, <strong>and</strong> climate) were<br />
extracted <strong>and</strong> formatted using the SWAT/GRASS input interface (Srinivasan <strong>and</strong> Arnold,<br />
1994). Specific values used in each watershed are discussed in the individual chapters.<br />
A1-6


