Teaching Modern Physics - QuarkNet - Fermilab
Teaching Modern Physics - QuarkNet - Fermilab
Teaching Modern Physics - QuarkNet - Fermilab

You also want an ePaper? Increase the reach of your titles
YUMPU automatically turns print PDFs into web optimized ePapers that Google loves.
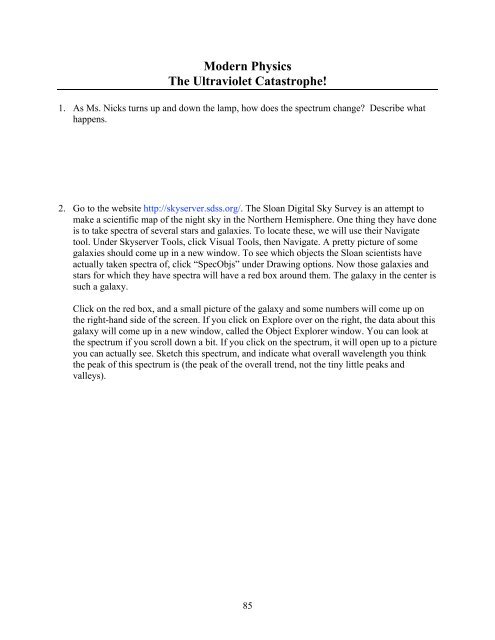
<strong>Modern</strong> <strong>Physics</strong><br />
The Ultraviolet Catastrophe!<br />
1. As Ms. Nicks turns up and down the lamp, how does the spectrum change? Describe what<br />
happens.<br />
2. Go to the website http://skyserver.sdss.org/. The Sloan Digital Sky Survey is an attempt to<br />
make a scientific map of the night sky in the Northern Hemisphere. One thing they have done<br />
is to take spectra of several stars and galaxies. To locate these, we will use their Navigate<br />
tool. Under Skyserver Tools, click Visual Tools, then Navigate. A pretty picture of some<br />
galaxies should come up in a new window. To see which objects the Sloan scientists have<br />
actually taken spectra of, click “SpecObjs” under Drawing options. Now those galaxies and<br />
stars for which they have spectra will have a red box around them. The galaxy in the center is<br />
such a galaxy.<br />
Click on the red box, and a small picture of the galaxy and some numbers will come up on<br />
the right-hand side of the screen. If you click on Explore over on the right, the data about this<br />
galaxy will come up in a new window, called the Object Explorer window. You can look at<br />
the spectrum if you scroll down a bit. If you click on the spectrum, it will open up to a picture<br />
you can actually see. Sketch this spectrum, and indicate what overall wavelength you think<br />
the peak of this spectrum is (the peak of the overall trend, not the tiny little peaks and<br />
valleys).<br />
85