THE XYZs OF USING A SCOPE Tektronix
THE XYZs OF USING A SCOPE Tektronix
THE XYZs OF USING A SCOPE Tektronix

You also want an ePaper? Increase the reach of your titles
YUMPU automatically turns print PDFs into web optimized ePapers that Google loves.
Figure 19.<br />
IF A SIGNAL IS PERIODIC, IT HAS A FREQUENCY. Frequency is the number of times<br />
a signal repeats itself in a second; frequency is measured in Hertz: 1 Hz = 1 cycle per<br />
second; 1 kHz (kilohertz) = 1000 cycles/second; and 1 MHz (megahertz) =<br />
1 ,OOO,OOO cycles/second. Period and frequency are reciprocal: l/period = frequency,<br />
and l/frequency = period. For example, a 7 Hz signal has a period of 0.143<br />
seconds: 1/7 Hz = 0.143 s, and 1/0.143 s = 7 Hz.<br />
Figure 20.<br />
<strong>THE</strong> PARAMETERS <strong>OF</strong> A PULSE can be important in a number of different applications.<br />
Digital circuitry, X-ray equipment, and data communications are examples.<br />
Pulse specifications include transition times measured on the leading edge of a<br />
positive-going transition; this is the rise time. Fall time is the transition time on a<br />
negative-going trailing edge. Pulse width is measured at the 50% points and<br />
amplitude from 0 to 100%. Any displacement from 0 volts for the base of the pulse is<br />
the baseline offset.<br />
Figure 21.<br />
DUTY CYCLE, DUTY FACTOR, AND<br />
REPETITION RATE are parameters of all<br />
rectangular waves. They are particularly<br />
important in digital circuitry. Duty cycle<br />
is the ratio of pulse width to signal period<br />
expressed as a percentage. For square<br />
waves, it’s always 50% as you can see;<br />
for the pulse wave in the second drawing,<br />
it’s 30%. Duty factor is the same<br />
thing as duty cycle except it is expressed<br />
as a decimal, not a percentage.<br />
A repetition rate describes how often a<br />
pulse train occurs and is used instead of<br />
frequency to describe waveforms like<br />
that in the second drawing.<br />
PART II<br />
Figure 22.<br />
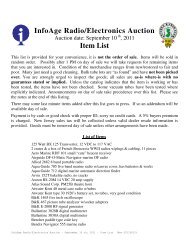
PHASE is best explained with a sine<br />
wave. Remember that this waveform is<br />
based on the sine of all the angles from 0<br />
through 360. The result is a plot that<br />
changes from 0 to 00,l at 900,O again at<br />
1800, -1 at 270”, and finally 0 again at<br />
360”. Consequently, it is useful to refer to<br />
the phase angle (or simply phase, when<br />
there is no ambiquity) of a sine wave<br />
when you want to describe how much of<br />
the period has elapsed. Another use of<br />
phase is found when you want to describe<br />
a relationship between two signals.<br />
Picture two clocks with their second<br />
hands sweeping the dial every 60<br />
seconds. If the second hands touch the<br />
twelve at the same time, the clocks are in<br />
phase; if they don’t, then they’re out of<br />
phase. To express how far out of phase<br />
they are, you use phase shift in degrees.<br />
To illustrate, the waveform labeled<br />
CURRENT in the drawing above is said<br />
to be 90” out of phase with the voltage<br />
waveform. Other ways of reporting the<br />
same information are “the current<br />
waveform has a 90 degree phase angle<br />
with respect to the voltage waveform” or<br />
“the current waveform lags the voltage<br />
waveform by 9OO.” Note that there is always<br />
a reference to another waveform;<br />
in this case, between the voltage and<br />
current waveforms of an inductor.<br />
21