Wavefront Sculpture Technology - R+R Sonicdesign AG
Wavefront Sculpture Technology - R+R Sonicdesign AG
Wavefront Sculpture Technology - R+R Sonicdesign AG

Create successful ePaper yourself
Turn your PDF publications into a flip-book with our unique Google optimized e-Paper software.
ENGINEERING REPORTS WAVEFRONT SCULPTURE TECHNOLOGY<br />
greater than 80%. Here ARF is too low (25/80 � 30%),<br />
and it can be concluded that above 2 kHz this array will<br />
exhibit severe problems in the near field.<br />
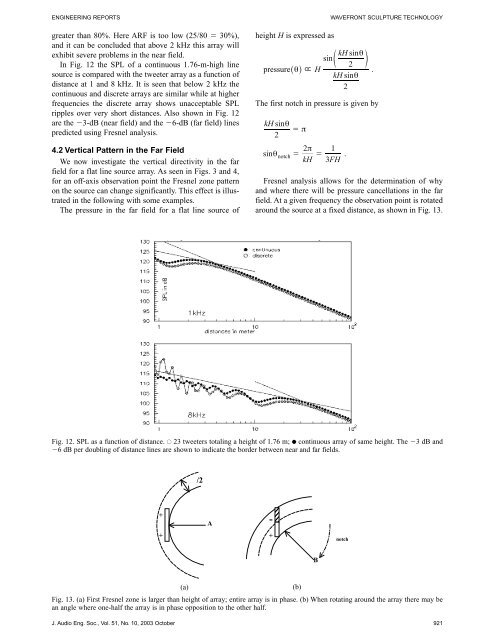
In Fig. 12 the SPL of a continuous 1.76-m-high line<br />
source is compared with the tweeter array as a function of<br />
distance at 1 and 8 kHz. It is seen that below 2 kHz the<br />
continuous and discrete arrays are similar while at higher<br />
frequencies the discrete array shows unacceptable SPL<br />
ripples over very short distances. Also shown in Fig. 12<br />
are the �3-dB (near field) and the �6-dB (far field) lines<br />
predicted using Fresnel analysis.<br />
4.2 Vertical Pattern in the Far Field<br />
We now investigate the vertical directivity in the far<br />
field for a flat line source array. As seen in Figs. 3 and 4,<br />
for an off-axis observation point the Fresnel zone pattern<br />
on the source can change significantly. This effect is illustrated<br />
in the following with some examples.<br />
The pressure in the far field for a flat line source of<br />
height H is expressed as<br />
kH sinθ<br />
sine<br />
o<br />
2<br />
pressure^θh " H<br />
.<br />
kH sinθ<br />
2<br />
The first notch in pressure is given by<br />
kH sinθ<br />
� π<br />
2<br />
2π<br />
1<br />
sinθ<br />
notch � �<br />
kH 3FH<br />
.<br />
Fresnel analysis allows for the determination of why<br />
and where there will be pressure cancellations in the far<br />
field. At a given frequency the observation point is rotated<br />
around the source at a fixed distance, as shown in Fig. 13.<br />
Fig. 12. SPL as a function of distance. ● 23 tweeters totaling a height of 1.76 m; ● continuous array of same height. The �3 dB and<br />
�6 dB per doubling of distance lines are shown to indicate the border between near and far fields.<br />
+<br />
+<br />
�/2<br />
A<br />
(a) (b)<br />
Fig. 13. (a) First Fresnel zone is larger than height of array; entire array is in phase. (b) When rotating around the array there may be<br />
an angle where one-half the array is in phase opposition to the other half.<br />
J. Audio Eng. Soc., Vol. 51, No. 10, 2003 October 921<br />
-<br />
+<br />
B<br />
�notch