Wavefront Sculpture Technology - R+R Sonicdesign AG
Wavefront Sculpture Technology - R+R Sonicdesign AG
Wavefront Sculpture Technology - R+R Sonicdesign AG

Create successful ePaper yourself
Turn your PDF publications into a flip-book with our unique Google optimized e-Paper software.
URBAN ET AL. ENGINEERING REPORTS<br />
above and below the line array. This is incorrect since in<br />
the near field the energy flow is in the forward direction,<br />
perpendicular to the line array.<br />
APPENDIX 2<br />
To conduct Fresnel analysis, circles with λ/2 increments<br />
in their radii are drawn, centered on the observation point.<br />
This may appear somewhat surprising since half a wavelength<br />
leads to a phase opposition. One edge of the zone<br />
is in phase opposition to the other edge of the zone, and<br />
consequently a small resultant SPL would be expected.<br />
Qualitatively, it can be demonstrated why Fresnel chose<br />
that value and why the SPL is not small but, on the contrary,<br />
reaches it’s maximum level.<br />
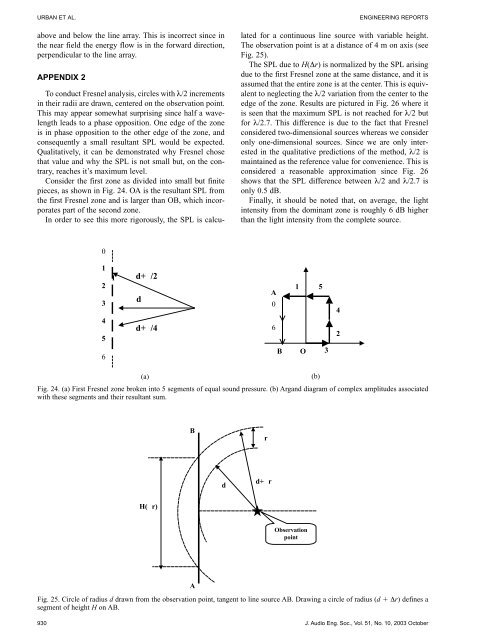
Consider the first zone as divided into small but finite<br />
pieces, as shown in Fig. 24. OA is the resultant SPL from<br />
the first Fresnel zone and is larger than OB, which incorporates<br />
part of the second zone.<br />
In order to see this more rigorously, the SPL is calcu-<br />
0<br />
1<br />
2<br />
3<br />
4<br />
5<br />
6<br />
1<br />
d+�/2<br />
d<br />
d+�/4<br />
(a) (b)<br />
H(�r)<br />
B<br />
A<br />
d<br />
lated for a continuous line source with variable height.<br />
The observation point is at a distance of 4 m on axis (see<br />
Fig. 25).<br />
The SPL due to H(∆r) is normalized by the SPL arising<br />
due to the first Fresnel zone at the same distance, and it is<br />
assumed that the entire zone is at the center. This is equivalent<br />
to neglecting the λ/2 variation from the center to the<br />
edge of the zone. Results are pictured in Fig. 26 where it<br />
is seen that the maximum SPL is not reached for λ/2 but<br />
for λ/2.7. This difference is due to the fact that Fresnel<br />
considered two-dimensional sources whereas we consider<br />
only one-dimensional sources. Since we are only interested<br />
in the qualitative predictions of the method, λ/2 is<br />
maintained as the reference value for convenience. This is<br />
considered a reasonable approximation since Fig. 26<br />
shows that the SPL difference between λ/2 and λ/2.7 is<br />
only 0.5 dB.<br />
Finally, it should be noted that, on average, the light<br />
intensity from the dominant zone is roughly 6 dB higher<br />
than the light intensity from the complete source.<br />
Fig. 24. (a) First Fresnel zone broken into 5 segments of equal sound pressure. (b) Argand diagram of complex amplitudes associated<br />
with these segments and their resultant sum.<br />
Fig. 25. Circle of radius d drawn from the observation point, tangent to line source AB. Drawing a circle of radius (d � ∆r) defines a<br />
segment of height H on AB.<br />
930 J. Audio Eng. Soc., Vol. 51, No. 10, 2003 October<br />
�r<br />
d+�r<br />
A<br />
0<br />
6<br />
B<br />
Observation<br />
point<br />
1 5<br />
O<br />
3<br />
4<br />
2