Wavefront Sculpture Technology - R+R Sonicdesign AG
Wavefront Sculpture Technology - R+R Sonicdesign AG
Wavefront Sculpture Technology - R+R Sonicdesign AG

You also want an ePaper? Increase the reach of your titles
YUMPU automatically turns print PDFs into web optimized ePapers that Google loves.
URBAN ET AL. ENGINEERING REPORTS<br />
ation of border distance and far-field coverage angle with<br />
frequency for a flat, continuous line source of 5.4-m<br />
height. For this example, the near field extends as far as<br />
88 m at 2 kHz.<br />
It should be noted that different authors have proposed<br />
various expressions for the border distance:<br />
•d B � 3H Smith [3]<br />
•d B � H/π Rathe [4]<br />
•d B � max (H, λ/6) Beranek [5]<br />
Most of these expressions omit the frequency dependence<br />
and are incorrect with regard to the size dependence.<br />
It was also demonstrated in [1] that a line array of<br />
sources, each radiating a flat isophase wavefront, will produce<br />
secondary lobes not greater than �13.5 dB with<br />
respect to the main lobe in the far field and SPL variations<br />
not greater than �3 dB within the near-field region, provided<br />
that:<br />
• Either the sum of the flat, individual radiating areas<br />
covers more than 80% of the vertical frame of the array,<br />
that is, the target radiating area, 2 or<br />
•The spacing between the acoustic centers of individual<br />
sound sources is smaller than 1/6F that is, λ/2, given the<br />
approximation that λ � 1/3F, where λ is the wavelength<br />
in meters and F is the frequency in kHz.<br />
These two requirements form the basis of WST criteria<br />
which, in turn, define conditions for the effective coupling<br />
of multiple sound sources. In the following sections these<br />
results are derived using the Fresnel approach along with<br />
2 A derivation of how flat the individual radiated wavefronts<br />
must be is given in Section 3.3.<br />
A<br />
B<br />
Third zone<br />
Second zone<br />
First zone<br />
Front view Side view<br />
further results concerning the prediction of line source<br />
array behavior.<br />
2 FRESNEL APPROACH FOR A CONTINUOUS<br />
LINE SOURCE<br />
The fact that light is a wave implies interference phenomena<br />
when an isophasic and extended light source is<br />
looked at from a given observation point. These interference<br />
patterns are not easy to predict, but in 1819 Fresnel<br />
described a way to visualize these patterns semiquantitatively.<br />
Fresnel’s approach was to partition the main light<br />
source into fictitious zones made up of elementary light<br />
sources. The zones are classified according to their arrival<br />
time differences to the observer in such a way that the first<br />
zone appears in phase to the observer (within a fraction of<br />
the wavelength λ). The next zone consists of elementary<br />
sources that are in phase at the observer position, but are<br />
collectively in phase opposition with respect to the first<br />
zone, and so on. A more precise analysis shows that the<br />
fraction of wavelength is λ/2 for a two-dimensional source<br />
and λ/2.7 for a one-dimensional source. (See Appendix 2<br />
for further details.)<br />
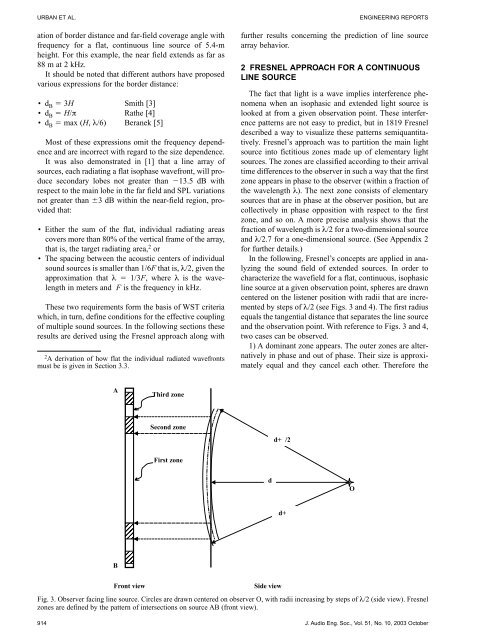
In the following, Fresnel’s concepts are applied in analyzing<br />
the sound field of extended sources. In order to<br />
characterize the wavefield for a flat, continuous, isophasic<br />
line source at a given observation point, spheres are drawn<br />
centered on the listener position with radii that are incremented<br />
by steps of λ/2 (see Figs. 3 and 4). The first radius<br />
equals the tangential distance that separates the line source<br />
and the observation point. With reference to Figs. 3 and 4,<br />
two cases can be observed.<br />
1) A dominant zone appears. The outer zones are alternatively<br />
in phase and out of phase. Their size is approximately<br />
equal and they cancel each other. Therefore the<br />
Fig. 3. Observer facing line source. Circles are drawn centered on observer O, with radii increasing by steps of λ/2 (side view). Fresnel<br />
zones are defined by the pattern of intersections on source AB (front view).<br />
914 J. Audio Eng. Soc., Vol. 51, No. 10, 2003 October<br />
d<br />
d+�/2<br />
d+�<br />
O