Wavefront Sculpture Technology - R+R Sonicdesign AG
Wavefront Sculpture Technology - R+R Sonicdesign AG
Wavefront Sculpture Technology - R+R Sonicdesign AG

Create successful ePaper yourself
Turn your PDF publications into a flip-book with our unique Google optimized e-Paper software.
URBAN ET AL. ENGINEERING REPORTS<br />
• At position A the observation point is in the far-field<br />
region and the entire source is in phase, providing maximum<br />
SPL.<br />
• At position B there is cancellation since half the sources<br />
are in phase whereas the rest are out of phase. This<br />
occurs at the angle θ notch (Fig. 14).<br />
In order for IJ to be equal to λ/2,<br />
sinθ<br />
H<br />
IJ � sinθ<br />
2<br />
notch<br />
notch<br />
λ 1<br />
� �<br />
H 3FH<br />
.<br />
This is the same result as obtained in Section 4.2 using the<br />
H/2<br />
I<br />
J<br />
�/2<br />
SPL along A’D’<br />
- 6 dB<br />
D’<br />
�notch<br />
Listener Position<br />
Fig. 14. Defining quantities used to determine θ notch .<br />
analytical formulation.<br />
It should be noted that the Fresnel approach does not<br />
give the exact functional behavior of the SPL but provides<br />
the characteristic features in a simple, intuitive way. It can<br />
be understood physically why there will be an angle where<br />
no SPL is produced and the angle can be calculated, but<br />
the sin x/x behavior cannot be derived. For complex situations<br />
where more detailed information is desired, numerical<br />
analysis techniques must be applied as in [1].<br />
For an on-axis listener position, the sound field is cylindrical<br />
up to the border distance d B . Moving the observation<br />
point slightly off the main axis can cause the SPL to<br />
change significantly. If there are several listeners at different<br />
positions and they are aligned on the main axis, then a<br />
flat array is acceptable. However, for most applications the<br />
audience is more off axis than on axis.<br />
4.3 Vertical Pattern in the Near Field<br />
As stated in Section 1 and [1], contrary to the far field,<br />
the SPL in the near field is not amenable to closed-form<br />
expressions. This is unfortunate since the near field can<br />
extend very far, especially at higher frequencies. However,<br />
by applying Fresnel analysis, the vertical pattern of the<br />
sound field in both the near and far fields can be described.<br />
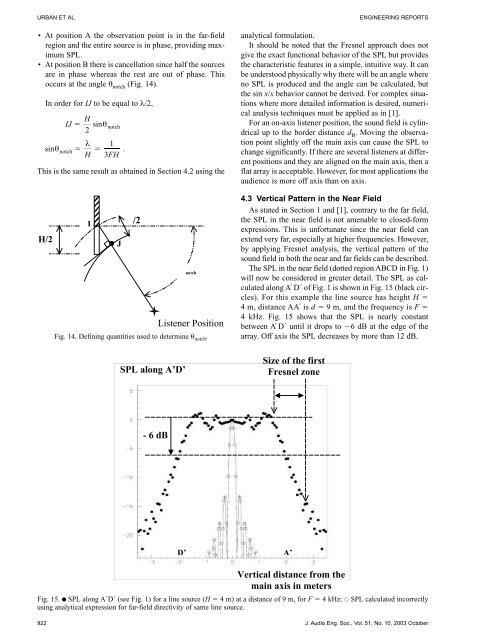
The SPL in the near field (dotted region ABCD in Fig. 1)<br />
will now be considered in greater detail. The SPL as calculated<br />
along A´ D´ of Fig. 1 is shown in Fig. 15 (black circles).<br />
For this example the line source has height H �<br />
4 m, distance AA´ is d � 9 m, and the frequency is F �<br />
4 kHz. Fig. 15 shows that the SPL is nearly constant<br />
between A´ D´ until it drops to �6 dB at the edge of the<br />
array. Off axis the SPL decreases by more than 12 dB.<br />
Size of the first<br />
Fresnel zone<br />
Vertical distance from the<br />
main axis in meters<br />
Fig. 15. ● SPL along A´D´ (see Fig. 1) for a line source (H � 4 m) at a distance of 9 m, for F � 4 kHz; ● SPL calculated incorrectly<br />
using analytical expression for far-field directivity of same line source.<br />
922 J. Audio Eng. Soc., Vol. 51, No. 10, 2003 October<br />
A’