

An overview of vis-nir-swir field spectroscopy - Spectral International
An overview of vis-nir-swir field spectroscopy - Spectral International
An overview of vis-nir-swir field spectroscopy - Spectral International

You also want an ePaper? Increase the reach of your titles
YUMPU automatically turns print PDFs into web optimized ePapers that Google loves.
________________________________________________________________<br />
concentration, water content and environmental considerations. For mineral<br />
identification, that signature is compared against characterized references for a<br />
validated identification. This can be done manually by using wavelength tables<br />
and overlaying references on the unknown or it can be done using computer<br />
algorithms operating against a database <strong>of</strong> references (i.e., a spectral library).<br />
For best results these libraries must be set up for specific deposit types, and not<br />
allow the algorithm to make a wrong choice.<br />
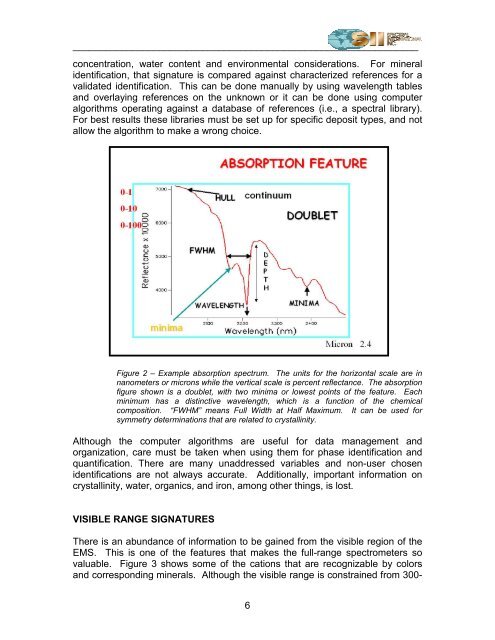
Figure 2 – Example absorption spectrum. The units for the horizontal scale are in<br />
nanometers or microns while the vertical scale is percent reflectance. The absorption<br />
figure shown is a doublet, with two minima or lowest points <strong>of</strong> the feature. Each<br />
minimum has a distinctive wavelength, which is a function <strong>of</strong> the chemical<br />
composition. “FWHM” means Full Width at Half Maximum. It can be used for<br />
symmetry determinations that are related to crystallinity.<br />
Although the computer algorithms are useful for data management and<br />
organization, care must be taken when using them for phase identification and<br />
quantification. There are many unaddressed variables and non-user chosen<br />
identifications are not always accurate. Additionally, important information on<br />
crystallinity, water, organics, and iron, among other things, is lost.<br />
VISIBLE RANGE SIGNATURES<br />
There is an abundance <strong>of</strong> information to be gained from the <strong>vis</strong>ible region <strong>of</strong> the<br />
EMS. This is one <strong>of</strong> the features that makes the full-range spectrometers so<br />
valuable. Figure 3 shows some <strong>of</strong> the cations that are recognizable by colors<br />
and corresponding minerals. Although the <strong>vis</strong>ible range is constrained from 300-<br />
6