PDF (Hi-Res) - Smithsonian Institution Libraries
PDF (Hi-Res) - Smithsonian Institution Libraries
PDF (Hi-Res) - Smithsonian Institution Libraries

You also want an ePaper? Increase the reach of your titles
YUMPU automatically turns print PDFs into web optimized ePapers that Google loves.
100 SMITHSONIAN CONTRIBUTIONS TO THE EARTH SCIENCES<br />
be derived solely from the metal-rich and metalpoor<br />
chondrule olivine with mean fayalite contents<br />
of 3.0 and 14.1, respectively. Indeed, several abraded<br />
chondrules with forsteritic olivine adjacent to<br />
matrix material suggest that all silicates do reflect<br />
primary compositions. Therefore, although silicates<br />
in the matrix may include olivine fragments<br />
derived from chondrules similar in composition to<br />
those studied, it must contain a separate Fe-rich<br />
olivine fraction. Secondly, olivine in metal-rich<br />
chondrules is enriched in Ca and depleted in Mn<br />
relative to olivine in metal-poor chondrules, possibly<br />
suggesting two separate chondrule fractions.<br />
The high-Ca olivine is Mg-rich (Fa, 0-10), occurs<br />
Q_<br />
1 .00,.<br />
0.80..<br />
0.60..<br />
0.40..<br />
0.20..<br />
0.00<br />
10 15 20 25 30<br />
HOLE PCT FERROSILITE<br />
predominantly in metal-rich chondrules, and trends<br />
from a high of 0.67% CaO for nearly pure forsterite<br />
to below 0.10% CaO at about Fa 10 (Figure 2).<br />
This grouping corresponds to the proposed hightemperature<br />
metal-rich chondrule fraction in<br />
Sharps (Dodd, 1971). This fraction is depleted in<br />
MnO but shows a positive rather than a negative<br />
correlation with fayalite content, also to about<br />
Fa 10 (Figure 3). Olivine with greater than about<br />
8% Fa (Fa 10), which includes most metal-poor<br />
chondrules and silicate fragments from the matrix,<br />
shows no correlation of either CaO or MnO concentration<br />
with fayalite content.<br />
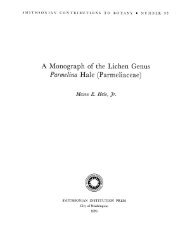
Most of the compositional zonation displayed in<br />
A<br />
• XTLS IN METflL-RICH CHOND<br />
A XTLS IN METRL-POOR CHOND<br />
+ MRTRIX CRYSTflLS<br />
- ZONED CRYSTflLS<br />
A<br />
A A<br />
FIGURE 4.—Plot of MnO vs ferrosilite content of low-Ca pyroxene (< 1% CaO) suggests an increase<br />
in manganese with increasing iron (lines join compositions in zoned crystals).