PDF (Hi-Res) - Smithsonian Institution Libraries
PDF (Hi-Res) - Smithsonian Institution Libraries
PDF (Hi-Res) - Smithsonian Institution Libraries

Create successful ePaper yourself
Turn your PDF publications into a flip-book with our unique Google optimized e-Paper software.
NUMBER 19 111<br />
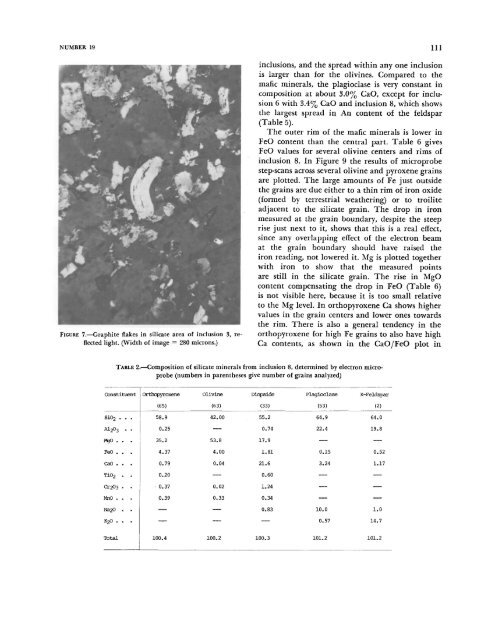
FIGURE 7.—Graphite flakes in silicate area of inclusion 3, reflected<br />
light. (Width of image = 280 microns.)<br />
inclusions, and the spread within any one inclusion<br />
is larger than for the olivines. Compared to the<br />
mafic minerals, the plagioclase is very constant in<br />
composition at about 3.0% CaO, except for inclusion<br />
6 with 3.4% CaO and inclusion 8, which shows<br />
the largest spread in An content of the feldspar<br />
(Table 5).<br />
The outer rim of the mafic minerals is lower in<br />
FeO content than the central part. Table 6 gives<br />
FeO values for several olivine centers and rims of<br />
inclusion 8. In Figure 9 the results of microprobe<br />
step-scans across several olivine and pyroxene grains<br />
are plotted. The large amounts of Fe just outside<br />
the grains are due either to a thin rim of iron oxide<br />
(formed by terrestrial weathering) or to troilite<br />
adjacent to the silicate grain. The drop in iron<br />
measured at the grain boundary, despite the steep<br />
rise just next to it, shows that this is a real effect,<br />
since any overlapping effect of the electron beam<br />
at the grain boundary should have raised the<br />
iron reading, not lowered it. Mg is plotted together<br />
with iron to show that the measured points<br />
are still in the silicate grain. The rise in MgO<br />
content compensating the drop in FeO (Table 6)<br />
is not visible here, because it is too small relative<br />
to the Mg level. In orthopyroxene Ca shows higher<br />
values in the grain centers and lower ones towards<br />
the rim. There is also a general tendency in the<br />
orthopyroxene for high Fe grains to also have high<br />
Ca contents, as shown in the CaO/FeO plot in<br />
TABLE 2.—Composition of silicate minerals from inclusion 8, determined by electron microprobe<br />
(numbers in parentheses give number of grains analyzed)<br />
Constituent<br />
SiO2 . . .<br />
AI2O3 • •<br />
MgO . . .<br />
FeO . . .<br />
CaO . . .<br />
TiO2 . .<br />
CT2O3 • •<br />
MnO . . .<br />
Na2O . .<br />
K2O . . .<br />
Total<br />
Orthopyroxene<br />
(65)<br />
58.9<br />
0.25<br />
35.2<br />
4.37<br />
0.79<br />
0.20<br />
0.37<br />
0.39<br />
100.4<br />
Olivine<br />
(63)<br />
42.00<br />
53.8<br />
4.00<br />
0.04<br />
0.02<br />
0.33<br />
100.2<br />
Diopside<br />
(33)<br />
55.2<br />
0.74<br />
17.9<br />
1.81<br />
21.6<br />
0.60<br />
1.24<br />
0.34<br />
0.83<br />
100.3<br />
Plagioclase<br />
(53)<br />
64.9<br />
22.4<br />
0.15<br />
3.24<br />
10.0<br />
0.57<br />
101.2<br />
K-Feldspar<br />
(2)<br />
64.0<br />
19.8<br />
0.52<br />
1.17<br />
1.0<br />
14.7<br />
101.2