PDF (Hi-Res) - Smithsonian Institution Libraries
PDF (Hi-Res) - Smithsonian Institution Libraries
PDF (Hi-Res) - Smithsonian Institution Libraries

Create successful ePaper yourself
Turn your PDF publications into a flip-book with our unique Google optimized e-Paper software.
114 SMITHSONIAN CONTRIBUTIONS TO THE EARTH SCIENCES<br />
TABLE 3.—FeO content of olivine grains in two thin sections<br />
as measured on two different days by electron microprobe<br />
Grain<br />
No.<br />
18<br />
23<br />
25<br />
89<br />
95<br />
80<br />
Mean<br />
SECTION 1<br />
Day 1 Day 2<br />
4.48 4.39<br />
4.07 4.10<br />
4.24 4.30<br />
4.04 4.00<br />
4.31 4.30<br />
4.39 4.39<br />
4.26 4.25<br />
Grain<br />
No.<br />
34<br />
36<br />
37<br />
40<br />
41<br />
45<br />
56<br />
62<br />
59<br />
71<br />
Mean<br />
SECTION 10<br />
Day 1 Day 2<br />
3.39 3.31<br />
3.60 3.77<br />
3.79 3.49<br />
3.61 3.57<br />
3.72 3.58<br />
3.86 3.73<br />
3.57 3.36<br />
3.40 3.38<br />
2.98 2.99<br />
3.83 3.73<br />
3.56 3.49<br />
Chemical Composition<br />
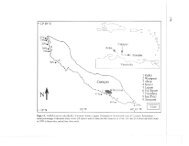
Samples of three silicate inclusions, weighing 3.5<br />
(no. 1), 6.7 (no. 2), and 9 (no. 3) grams, respectively,<br />
were taken for chemical analysis. Number 1 was a<br />
surface inclusion, and the location of the other two<br />
is shown in Figure 3. These samples contained<br />
varying amounts of metal as grains dispersed<br />
throughout the silicate matrix and veinlets or protrusions<br />
extending from the main mass of meteorite<br />
into the silicates. Each sample was ground in a<br />
tungsten carbide mill and passed through a 100mesh<br />
sieve to separate coarse metallic particles<br />
from finely ground silicates. Since for this study<br />
analyses of the silicates are of prime interest, only<br />
the fraction less than 100 mesh was used for<br />
analysis. The bulk chemical analysis was performed<br />
in a manner similar to that described earlier<br />
(Jarosewich, 1966). The results are shown in Table<br />
TABLE 4.—Average FeO content of olivine and FeO and CaO content (weight percent) of<br />
orthopyroxene of all thin sections studied<br />
Inclusion:<br />
Section" 1 "<br />
2<br />
2<br />
2:<br />
2 :<br />
1 :<br />
3 : 1<br />
4 : 10.1<br />
10.2<br />
5 :<br />
6 :<br />
8 :<br />
11 :<br />
3.1<br />
3.2<br />
4<br />
9.1<br />
9.2<br />
7<br />
2<br />
5.1<br />
5.2<br />
6.1<br />
6.2<br />
8.1<br />
8.2<br />
11<br />
12. 1*12.1<br />
12. 2*12.2<br />
22<br />
24<br />
47<br />
21<br />
23<br />
14<br />
40<br />
25<br />
17<br />
26<br />
26<br />
31<br />
11<br />
38<br />
24<br />
39<br />
16<br />
32<br />
30<br />
Olivine<br />
FeO<br />
A<br />
3.88 ± 0.10<br />
3.84 ± 0.19<br />
3.75 ± 0.26<br />
3.87 ± 0.21<br />
3.88 ± 0.19<br />
3.98 ± 0.15<br />
4.06 ± 0.25<br />
4.16 ± 0.14<br />
3.54 ± 0.19<br />
3.60 ± 0.17<br />
4.46 ± 0.19<br />
4.62 + 0.17<br />
3.57 ± 0.25<br />
3.56 ± 0.28<br />
3.99 + 0.15<br />
4.00 ± 0.26<br />
3.63 ± 0.17<br />
4.03 ± 0.25<br />
3.66 ± 0.26<br />
n<br />
29<br />
51<br />
96<br />
26<br />
25<br />
32<br />
29<br />
40<br />
34<br />
37<br />
14<br />
27<br />
35<br />
57<br />
39<br />
26<br />
27<br />
40<br />
33<br />
FeO<br />
4.34<br />
4.29<br />
4.51<br />
4.42<br />
4.51<br />
4.24<br />
4.00<br />
Or thopyroxene<br />
A<br />
t 0.25<br />
t 0.36<br />
t 0.31<br />
t 0.19<br />
t 0.30<br />
t 0.35<br />
t 0.36<br />
4.54 : t 0.42<br />
4.24 dt<br />
0.33<br />
4.26 db<br />
0.40<br />
3.98 it<br />
0.30<br />
4.11 dt<br />
0.16<br />
4.60 d 0.23<br />
4.70 = t 0.32<br />
4.32 i^<br />
0.26<br />
4.16 i 0.29<br />
3.85 i 0.23<br />
4.40 i 0.39<br />
4.28 d 0.26<br />
CaO<br />
0.76 ± 0.07<br />
0.77 ± 0.09<br />
0.85<br />
-<br />
A<br />
0.80 ± 0.06<br />
0.82 ± 0.09<br />
0.74 ± 0.10<br />
0.78 ± 0.11<br />
0.90 ± 0.15<br />
0.76 ± 0.14<br />
0.82 ± 0.15<br />
0.69 ± 0.09<br />
0.72 ± 0.08<br />
0.86 ± 0.10<br />
0.94 ± 0.17<br />
0.79 ± 0.07<br />
0.75 ± 0.16<br />
0.73 ± 0.07<br />
0.84 ± 0.13<br />
0.78 ± 0.09<br />
The suffix .1 or .2 following a thin section number means that two different areas in the same section<br />
were probed.<br />
n = number of grains analyzed<br />
A = values giving the standard deviation calculated from the distribution of the £ measurements, not<br />
from counting statistics.<br />
Fa = fayalite Fe~SiO,, mole percent<br />
Fs = ferrosilite FeSiO,, mole percent<br />
*Inclusions 12.1 and 12.2 are two different pieces on section 12.<br />
Fa<br />
3.8<br />
3.7<br />
3.8<br />
4.0<br />
4.0<br />
4.1<br />
3.5<br />
4.5<br />
3.5<br />
4.0<br />
3.6<br />
4.0<br />
3.6<br />
Fs<br />
6.0<br />
6.3<br />
6.2<br />
5.9<br />
5.6<br />
6.4<br />
5.9<br />
5.7<br />
6.6<br />
5.9<br />
5.4<br />
6.2<br />
6.0<br />
Fa/Fs<br />
0.63<br />
0.58<br />
0.61<br />
0.68<br />
0.71<br />
0.64<br />
0.59<br />
0.79<br />
0.53<br />
0.68<br />
0.67<br />
0.64<br />
0.60