

Signal Analysis Research (SAR) Group - RNet - Ryerson University
Signal Analysis Research (SAR) Group - RNet - Ryerson University
Signal Analysis Research (SAR) Group - RNet - Ryerson University

Create successful ePaper yourself
Turn your PDF publications into a flip-book with our unique Google optimized e-Paper software.
Proceedings - 19th International Conference - IEEE/EMBS Oct. 30 - Nov. 2, 1997 Chicago, IL. USA<br />
The MP method represents a signal z(t) as:<br />
where<br />
and a, are the expansion coefficients. The scale factor s,<br />
is used to control the width of the envelope of grn(t), and<br />
the parameter p, controls the temporal placement. -&<br />
is a normalizing factor, which keeps the norm of gyn(t)<br />
equal to 1. The parameters fn and 4, are the frequency<br />
and phase of the exponential function, respectively. In<br />
our application, the envelope function is a Gaussian func-<br />
tion, i.e., g(t) = 2'14 exp(--Kt2); the TF atoms are then<br />
called Gabor functions.<br />
In practice, the algorithm works as follows: First,<br />
the signal is projected on to a Gabor function dictionary.<br />
The projection decomposes the signal into two parts:<br />
4t) = (",gro)g-Yo(t) + R14% (3)<br />
where (2, gyo) denotes the inner product (projection) of<br />
z(t) with the first TF atom gro(t). The second term<br />
R'z(t) is the residual vector after approximating z(t)<br />
in the direction of gyo(t). This process is continued by<br />
projecting the residue on to the dictionary, and after M<br />
iterations<br />
M-1<br />
42) = (R"z,g,,)g,,(t) + R'4% (4)<br />
n=O<br />
with Roz(t) = ~ (2). There are two ways of stopping the<br />
iterative process: one is to use a pre-specified limiting<br />
number A4 of TF atoms, and the other is to verify the<br />
energy of the residue RMz(t). A very high value of M<br />
and a zero value for the residual energy will decompose<br />
the signal completely at the expense of increased compu-<br />
tational complexity.<br />
In this work, M was chosen to be 1000 atoms, the<br />
residual energy limit was set to be zero, and only coherent<br />
structures were extracted (i.e., components determined to<br />
be noise by the MP algorithm were rejected).<br />
Now, the Wigner distribution of t(t) based on the<br />
TF atoms is given as [6]:<br />
M-1<br />
W(t,w) = I(Rnz,g,n)12 Wgyn(t,u)+<br />
n=O<br />
-<br />
i<br />
P o<br />
-20<br />
-40<br />
Time samples (1 to 8 I92 samples)<br />
@)<br />
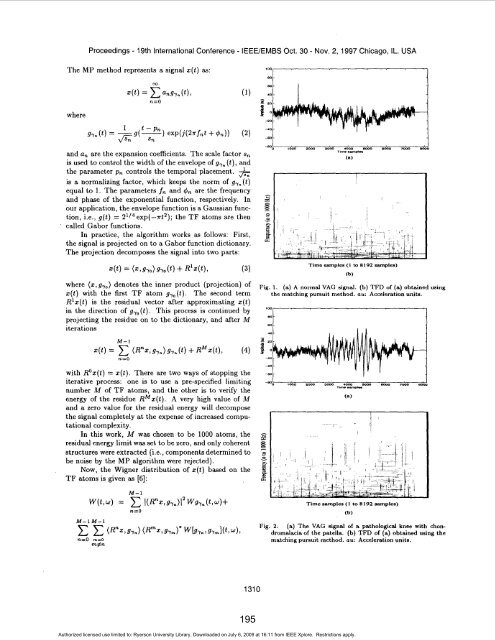
Fig. 1. (a) A normal VAG signal. (b) TFD of (a) obtained using<br />
the matching pursuit method. au: Acceleration units.<br />
Time samples ( I to R 192 samples)<br />
(b)<br />
M-1 M-1<br />
Fig. 2. (a) The VAG signal of a pathological knee with chon-<br />
(R"z,grn) (Rmwrm)* ~bYn,gYml(t>4, dromalacia of the patella. (b) TFD of (a) obtained using the<br />
n=O m=o matching pursuit method. au: Acceleration units.<br />
m#n<br />
1310<br />
195<br />
Authorized licensed use limited to: <strong>Ryerson</strong> <strong>University</strong> Library. Downloaded on July 6, 2009 at 16:11 from IEEE Xplore. Restrictions apply.