

Signal Analysis Research (SAR) Group - RNet - Ryerson University
Signal Analysis Research (SAR) Group - RNet - Ryerson University
Signal Analysis Research (SAR) Group - RNet - Ryerson University

Create successful ePaper yourself
Turn your PDF publications into a flip-book with our unique Google optimized e-Paper software.
Amplitude<br />
60<br />
50<br />
40<br />
30<br />
20<br />
10<br />
This full text paper was peer reviewed at the direction of IEEE Communications Society subject matter experts for publication in the ICC 2007 proceedings.<br />
0<br />
0 0.05 0.1 0.15 0.2 0.25 0.3 0.35 0.4 0.45 0.5<br />
Normalized Frequency<br />
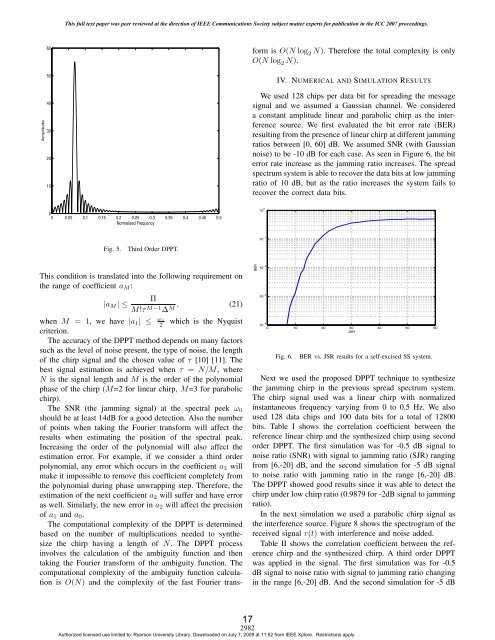
Fig. 5. Third Order DPPT.<br />
This condition is translated into the following requirement on<br />
the range of coefficient aM:<br />
|aM |≤<br />
Π<br />
M!τ M−1 , (21)<br />
∆M when M = 1, we have |a1| ≤ ωs<br />
2 which is the Nyquist<br />
criterion.<br />
The accuracy of the DPPT method depends on many factors<br />
such as the level of noise present, the type of noise, the length<br />
of the chirp signal and the chosen value of τ [10] [11]. The<br />
best signal estimation is achieved when τ = N/M, where<br />
N is the signal length and M is the order of the polynomial<br />
phase of the chirp (M=2 for linear chirp, M=3 for parabolic<br />
chirp).<br />
The SNR (the jamming signal) at the spectral peek ω0<br />
should be at least 14dB for a good detection. Also the number<br />
of points when taking the Fourier transform will affect the<br />
results when estimating the position of the spectral peak.<br />
Increasing the order of the polynomial will also affect the<br />
estimation error. For example, if we consider a third order<br />
polynomial, any error which occurs in the coefficient a3 will<br />
make it impossible to remove this coefficient completely from<br />
the polynomial during phase unwrapping step. Therefore, the<br />
estimation of the next coefficient a2 will suffer and have error<br />
as well. Similarly, the new error in a2 will affect the precision<br />
of a1 and a0.<br />
The computational complexity of the DPPT is determined<br />
based on the number of multiplications needed to synthesize<br />
the chirp having a length of N. The DPPT process<br />
involves the calculation of the ambiguity function and then<br />
taking the Fourier transform of the ambiguity function. The<br />
computational complexity of the ambiguity function calculation<br />
is O(N) and the complexity of the fast Fourier trans-<br />
form is O(N log 2 N). Therefore the total complexity is only<br />
O(N log 2 N).<br />
IV. NUMERICAL AND SIMULATION RESULTS<br />
We used 128 chips per data bit for spreading the message<br />
signal and we assumed a Gaussian channel. We considered<br />
a constant amplitude linear and parabolic chirp as the interference<br />
source. We first evaluated the bit error rate (BER)<br />
resulting from the presence of linear chirp at different jamming<br />
ratios between [0, 60] dB. We assumed SNR (with Gaussian<br />
noise) to be -10 dB for each case. As seen in Figure 6, the bit<br />
error rate increase as the jamming ratio increases. The spread<br />
spectrum system is able to recover the data bits at low jamming<br />
ratio of 10 dB, but as the ratio increases the system fails to<br />
recover the correct data bits.<br />
BER<br />
10 0<br />
10 −1<br />
10 −2<br />
10 −3<br />
10<br />
0 10 20 30 40 50 60<br />
−4<br />
JSR<br />
Fig. 6. BER vs. JSR results for a self-excised SS system.<br />
Next we used the proposed DPPT technique to synthesize<br />
the jamming chirp in the previous spread spectrum system.<br />
The chirp signal used was a linear chirp with normalized<br />
instantaneous frequency varying from 0 to 0.5 Hz. We also<br />
used 128 data chips and 100 data bits for a total of 12800<br />
bits. Table I shows the correlation coefficient between the<br />
reference linear chirp and the synthesized chirp using second<br />
order DPPT. The first simulation was for -0.5 dB signal to<br />
noise ratio (SNR) with signal to jamming ratio (SJR) ranging<br />
from [6,-20] dB, and the second simulation for -5 dB signal<br />
to noise ratio with jamming ratio in the range [6,-20] dB.<br />
The DPPT showed good results since it was able to detect the<br />
chirp under low chirp ratio (0.9879 for -2dB signal to jamming<br />
ratio).<br />
In the next simulation we used a parabolic chirp signal as<br />
the interference source. Figure 8 shows the spectrogram of the<br />
received signal r(t) with interference and noise added.<br />
Table II shows the correlation coefficient between the reference<br />
chirp and the synthesized chirp. A third order DPPT<br />
was applied in the signal. The first simulation was for -0.5<br />
dB signal to noise ratio with signal to jamming ratio changing<br />
in the range [6,-20] dB. And the second simulation for -5 dB<br />
17<br />
2982<br />
Authorized licensed use limited to: <strong>Ryerson</strong> <strong>University</strong> Library. Downloaded on July 7, 2009 at 11:52 from IEEE Xplore. Restrictions apply.